Comparing Saudi Aramco’s $1.9T Valuation to Its Rivals
The Top Retailers in the World, by Store Count
Visualizing Berkshire Hathaway’s Stock Portfolio (Q1 2024)
Nvidia is Worth More Than All of These Companies Combined
Which Retailers Operate in the Most Countries?
What Laptop Brands do Americans Use in 2024?
Ranked: The Top Startup Cities Around the World
Visualizing the 5 Most Common Cybersecurity Mistakes
Countries With the Highest Rates of Crypto Ownership
Mapped: The Income a Family Needs to Live Comfortably in Every U.S. State
Top 10 Countries Most in Debt to the IMF
Visualizing America’s Average Retirement Savings, by Age
Visualizing the Tax Burden of Every U.S. State
Charted: What Frustrates Americans About the Tax System
Visualizing Daily Protein Sources by Region
Mapped: Countries Where Recreational Cannabis is Legal
Which Countries Have the Highest Infant Mortality Rates?
Life Expectancy by Region (1950-2050F)
What Causes Preventable Child Deaths?
Ranked: The World’s Largest Lithium Producers in 2023
Who’s Building the Most Solar Energy?
Mapped: The Age of Energy Projects in Interconnection Queues, by State
Ranked: The Top 10 EV Battery Manufacturers in 2023
Mapped: Chinese Provinces With Cities Over 1 Million People
Map: Where Are America’s Largest Landfills?
Mapped: The World’s Wettest and Driest Countries
Mapped: Indian States with Cities Over 1 Million People
Visualizing Cobalt Production by Country in 2023
The Biggest Salt Producing Countries in 2023
Visualizing Copper Production by Country in 2023
Where the World’s Aluminum is Smelted, by Country
How People Get Around in America, Europe, and Asia
The Carbon Footprint of Major Travel Methods
Ranking the Top 15 Countries by Carbon Tax Revenue
Ranked: The Countries With the Most Air Pollution in 2023
Top Countries By Forest Growth Since 2001
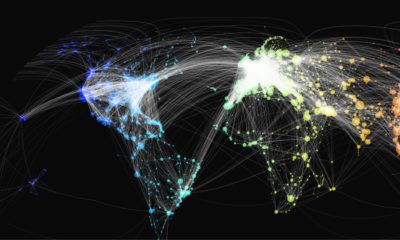
This map shows over 65,000 of the world’s flight paths and the various airports that each route connects, using data from Open Flights.
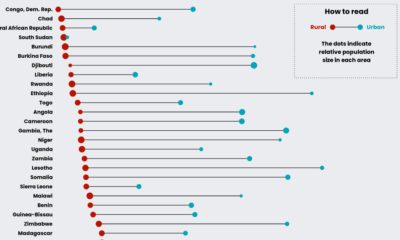
This graphic compares water accessibility in countries across Sub-Saharan Africa, showing the gap between its rural and urban populations.
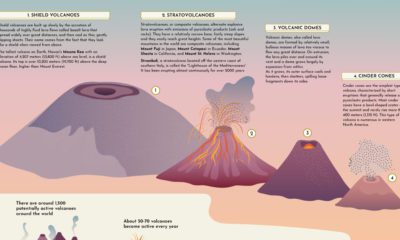
This graphic provides a brief introduction to volcanoes, explaining their different types of shapes and sizes, and how they erupt.
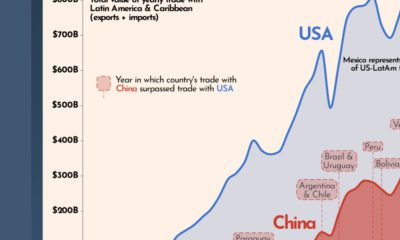
Over the last two decades, trade between China and Latin America has grown significantly, which has threatened U.S. dominance in the region.
Here are 10 razors, or rules of thumb, that help simplify decision-making, inspired by a list curated by the investor and thought leader Sahil Bloom.
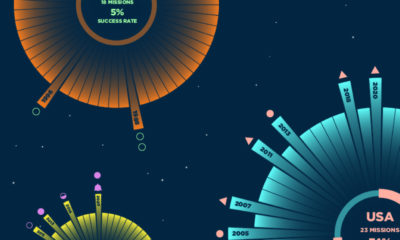
This graphic shows a timeline of every mission to Mars since 1960, highlighting which ones have been successful and which ones haven't.
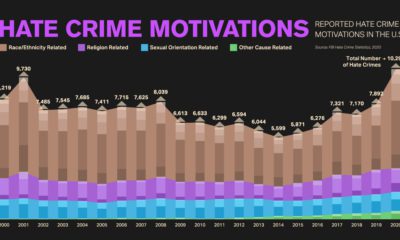
Hate crimes across the U.S. have been on the rise since 2014. Here's a look at the most common types of offenses over the years.
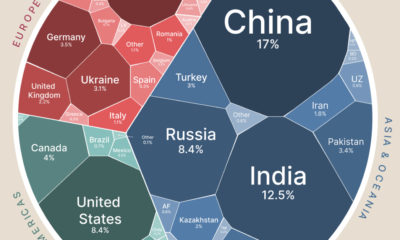
Global wheat production is concentrated in just a handful of countries. Here’s a look at the top wheat-producing countries worldwide.
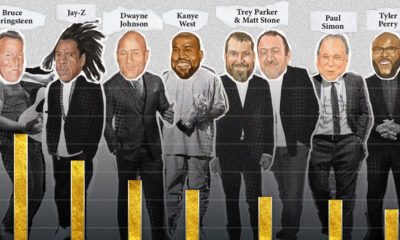
In 2021, the top 10 highest-paid celebrities earned a combined $2.7 billion. Peter Jackson came in first place, earning $580 million.
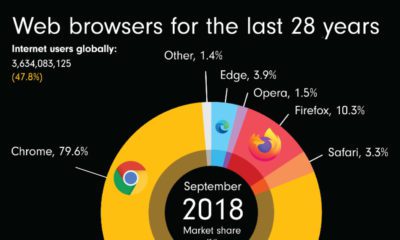
This animation shows the evolution of web browser market share since 1994, showing the rise and fall of various internet portals.


 Creator Program