Misc
Ranked: Top 10 Highest-Paid Celebrities
Article/Editing:
Ranked: Top 10 Highest-Paid Celebrities
It can be hard to make money in media—but for those lucky enough to make it to the big leagues, the payoff can be astronomical .
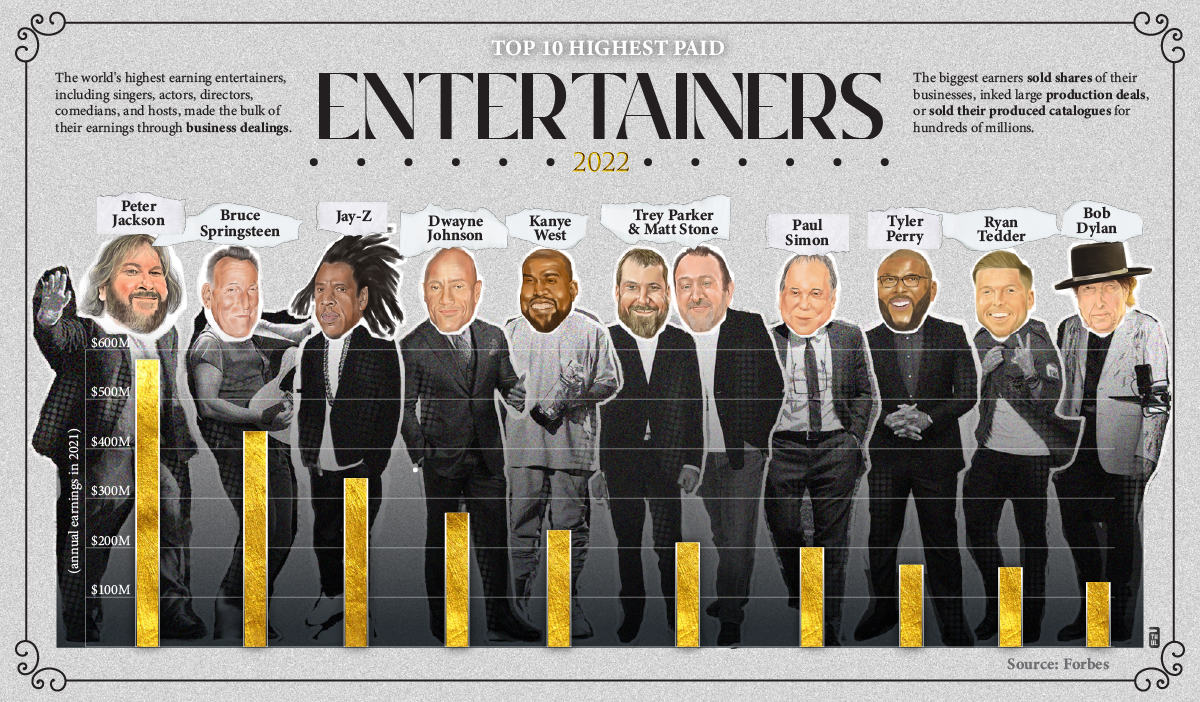
In 2021, the world’s 10 highest-paid celebrities earned a combined $2.7 billion. Who are these high-earning entertainers, and how do they make their hundreds of millions?
Using data from Forbes, this graphic by Athul Alexander highlights the top paid entertainers around the world, based on 2021 pre-tax earnings (minus business expenses such as management fees, agent costs, etc).
The Highest-Paid Celebrities in 2021
The world’s celebrities may be well known for the media they produce, but the bulk of their earnings are made through business dealings.
First on the list is New Zealand director Peter Jackson, best known for directing, producing, and writing the screenplays for the Lord of the Rings and Hobbit trilogies.
| Rank | Name | Nationality | 2021 pre-tax earnings |
|---|---|---|---|
| 1 | Peter Jackson | 🇳🇿 New Zealander | $580 million |
| 2 | Bruce Springsteen | 🇺🇸 American | $435 million |
| 3 | Jay-Z | 🇺🇸 American | $340 million |
| 4 | Dwanye "The Rock" Johnson | 🇨🇦 🇺🇸 American/Canadian | $270 million |
| 5 | Kanye West | 🇺🇸 American | $235 million |
| 6 | Trey Parker and Matt Stone | 🇺🇸 American | $210 million |
| 7 | Paul Simon | 🇺🇸 American | $200 million |
| 8 | Tyler Perry | 🇺🇸 American | $165 million |
| 9 | Ryan Tedder | 🇺🇸 American | $160 million |
| 10 | Bob Dylan | 🇺🇸 American | $130 million |
In addition to creating and directing blockbuster hits, Jackson is also the founder of the VFX studio Weta Digital, which he sold a portion of last year for a whopping $1.6 billion and the bulk of his earnings.
Second on the list is singer, songwriter, and musician Bruce Springsteen, who earned an estimated $435 million in 2021. Like Jackson, Springsteen’s earnings came from a major sale, as he sold Sony Music the rights to his entire music collection in a deal worth nearly $500 million last December.
One of the only actors on the list is Dwayne “The Rock” Johnson, who comes in fourth place with an estimated $270 million in 2021 pre-tax earnings. But only about a quarter of his earnings came from leading roles in movies like Jungle Cruise and Red Notice, with the bulk coming from his tequila brand Teremana.
Some High-Level Trends
Taking a closer look at this list reveals a few trends worth highlighting:
- Nine out of 10 entertainers on the list are American
- Only two actors made the list, while six are musicians
- All of top 10 earners in 2021 were men
Hollywood’s gender pay gap has been a hot topic of conversation over the last few years. Research indicates that there’s about a one-million-dollar pay gap between male and female actors at the “superstar” level.
But the gender gap in the entertainment industry extends further than that—women aren’t just underpaid compared to their male counterparts, they’re also just underrepresented, especially in big-decision, behind-the-scenes roles, and may subsequently miss out on the business opportunities made available.
Women have made the top 10 earners in Forbes celebrity rankings in recent years, including Kylie Jenner from 2018-2020, Taylor Swift in 2019, and Judge Judy Sheindlin in 2018. But they were the only females in an upper echelon of celebrity earners composed mainly by males.
Comparing YouTubers to Traditional Celebrities
As social media and online entertainment continue to gain traction, it’s interesting to see how much social media creators are earning compared to their traditional media counterparts.
According to Forbes, the highest-paid YouTuber (Jimmy Donaldson, better known as MrBeast) earned $54 million in 2021. Notably, that would place MrBeast in the top 25 of celebrity earners, just ahead of Taylor Swift’s $52 million in 2021.
With more celebrities embracing social media to grow followings and earnings revenue, it might not be long before we see more influencers and social media creators in the list of the world’s highest-earning celebrities.

This article was published as a part of Visual Capitalist's Creator Program, which features data-driven visuals from some of our favorite Creators around the world.


Maps
The Largest Earthquakes in the New York Area (1970-2024)
The earthquake that shook buildings across New York in April 2024 was the third-largest quake in the Northeast U.S. over the past 50 years.


The Largest Earthquakes in the New York Area
This was originally posted on our Voronoi app. Download the app for free on Apple or Android and discover incredible data-driven charts from a variety of trusted sources.
The 4.8 magnitude earthquake that shook buildings across New York on Friday, April 5th, 2024 was the third-largest quake in the U.S. Northeast area over the past 50 years.
In this map, we illustrate earthquakes with a magnitude of 4.0 or greater recorded in the Northeastern U.S. since 1970, according to the United States Geological Survey (USGS).
Shallow Quakes and Older Buildings
The earthquake that struck the U.S. Northeast in April 2024 was felt by millions of people from Washington, D.C., to north of Boston. It even caused a full ground stop at Newark Airport.
The quake, occurring just 5 km beneath the Earth’s surface, was considered shallow, which is what contributed to more intense shaking at the surface.
According to the USGS, rocks in the eastern U.S. are significantly older, denser, and harder than those on the western side, compressed by time. This makes them more efficient conduits for seismic energy. Additionally, buildings in the Northeast tend to be older and may not adhere to the latest earthquake codes.
Despite disrupting work and school life, the earthquake was considered minor, according to the Michigan Technological University magnitude scale:
| Magnitude | Earthquake Effects | Estimated Number Each Year |
|---|---|---|
| 2.5 or less | Usually not felt, but can be recorded by seismograph. | Millions |
| 2.5 to 5.4 | Often felt, but only causes minor damage. | 500,000 |
| 5.5 to 6.0 | Slight damage to buildings and other structures. | 350 |
| 6.1 to 6.9 | May cause a lot of damage in very populated areas. | 100 |
| 7.0 to 7.9 | Major earthquake. Serious damage. | 10-15 |
| 8.0 or greater | Great earthquake. Can totally destroy communities near the epicenter. | One every year or two |
The largest earthquake felt in the area over the past 50 years was a 5.3 magnitude quake that occurred in Au Sable Forks, New York, in 2002. It damaged houses and cracked roads in a remote corner of the Adirondack Mountains, but caused no injuries.
| Date | Magnitude | Location | State |
|---|---|---|---|
| April 20, 2002 | 5.3 | Au Sable Forks | New York |
| October 7, 1983 | 5.1 | Newcomb | New York |
| April 5, 2024 | 4.8 | Whitehouse Station | New Jersey |
| October 16, 2012 | 4.7 | Hollis Center | Maine |
| January 16, 1994 | 4.6 | Sinking Spring | Pennsylvania |
| January 19, 1982 | 4.5 | Sanbornton | New Hampshire |
| September 25, 1998 | 4.5 | Adamsville | Pennsylvania |
| June 9, 1975 | 4.2 | Altona | New York |
| May 29, 1983 | 4.2 | Peru | Maine |
| April 23, 1984 | 4.2 | Conestoga | Pennsylvania |
| January 16, 1994 | 4.2 | Sinking Spring | Pennsylvania |
| November 3, 1975 | 4 | Long Lake | New York |
| June 17, 1991 | 4 | Worcester | New York |
The largest earthquake in U.S. history, however, was the 1964 Good Friday quake in Alaska, measuring 9.2 magnitude and killing 131 people.

-

 Misc2 weeks ago
Tesla Is Once Again the World’s Best-Selling EV Company
-

 AI1 week ago
The Stock Performance of U.S. Chipmakers So Far in 2024
-

 Misc1 week ago
Almost Every EV Stock is Down After Q1 2024
-

 Money2 weeks ago
Where Does One U.S. Tax Dollar Go?
-

 Green2 weeks ago
Ranked: Top Countries by Total Forest Loss Since 2001
-

 Real Estate2 weeks ago
Visualizing America’s Shortage of Affordable Homes
-

 Maps2 weeks ago
Mapped: Average Wages Across Europe
-

 Mining2 weeks ago
Charted: The Value Gap Between the Gold Price and Gold Miners