The World’s Top Retail Companies, by Domestic Revenue
Ten Classic American Brands Owned by Foreign Companies
Ranked: U.S. Cities with the Highest Rent in 2024
Mapped: Where Tesla and BYD Make Their Cars
Ranked: The Countries Most Dependent on Agricultural Exports
What is the Median Pay of Magnificent Seven Companies?
Visualizing the 15 Most Valuable Bitcoin Addresses
Charted: How Many Data Centers do Major Big Tech Companies Have?
Visualizing the Training Costs of AI Models Over Time
Visualizing the Top Countries, by Mobile Data Usage
Ranked: The Countries Receiving the Most Remittances From Abroad
Mapped: The Income Needed to Live Comfortably in Every U.S. State
Charted: America’s Shift to a Cashless Society
Mapped: The Income a Family Needs to Live Comfortably in Every U.S. State
Which Countries Have Universal Health Coverage?
Visualizing Daily Protein Sources by Region
Mapped: Countries Where Recreational Cannabis is Legal
Which Countries Have the Highest Infant Mortality Rates?
Life Expectancy by Region (1950-2050F)
Comparing Saudi Aramco’s $1.9T Valuation to Its Rivals
Ranked: The World’s Largest Lithium Producers in 2023
Who’s Building the Most Solar Energy?
Mapped: The Age of Energy Projects in Interconnection Queues, by State
Ranked: The Top 10 EV Battery Manufacturers in 2023
Mapped: The Population of China and India in Perspective
Mapped: The 10 Hottest and Coldest Countries in the World
Map: The World’s Oldest and Youngest Countries, by Median Age
Ranked: Countries with the Most Embassies Around the World
Visualizing Raw Steel Production in 2023
Visualizing Cobalt Production by Country in 2023
The Biggest Salt Producing Countries in 2023
Visualizing Copper Production by Country in 2023
Ranked: Top 20 Countries by Plastic Waste per Capita
How People Get Around in America, Europe, and Asia
The Carbon Footprint of Major Travel Methods
Ranking the Top 15 Countries by Carbon Tax Revenue
Ranked: The Countries With the Most Air Pollution in 2023
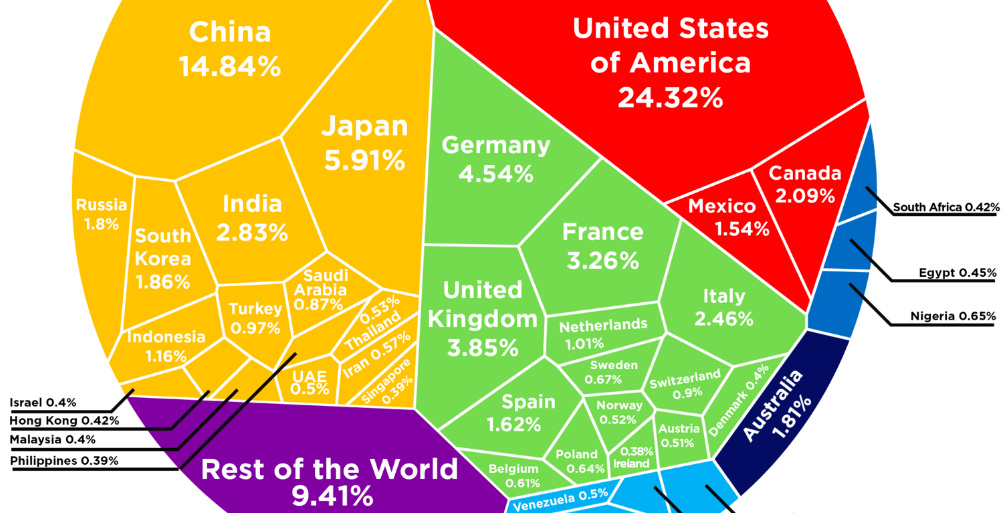
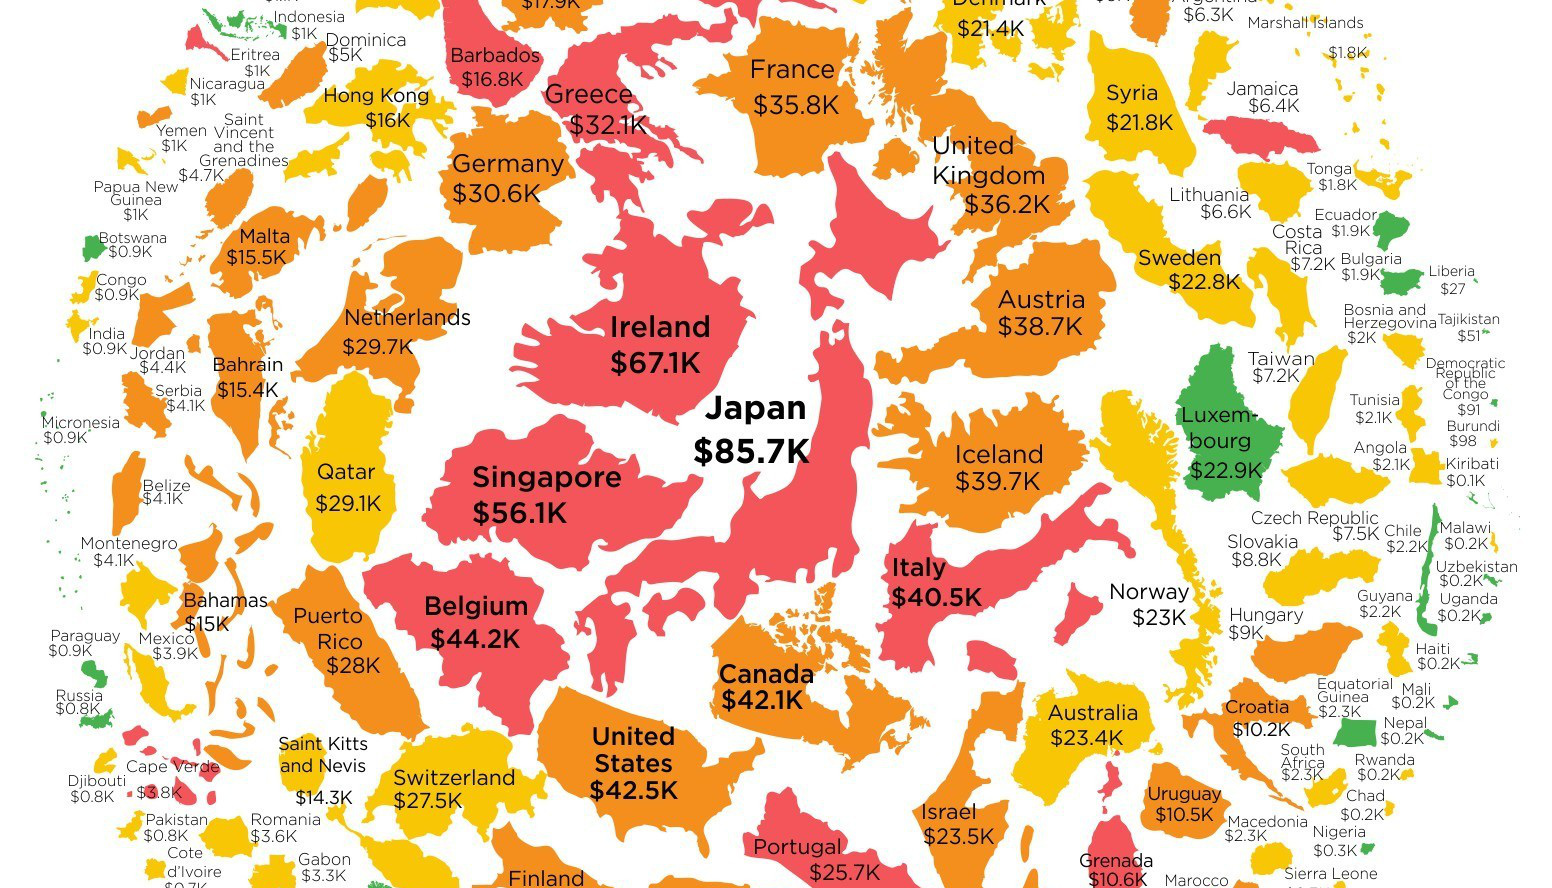
See how the multi-trillion dollar pie of the global economy gets divided between countries, based on the latest data from the World Bank from February 2017.
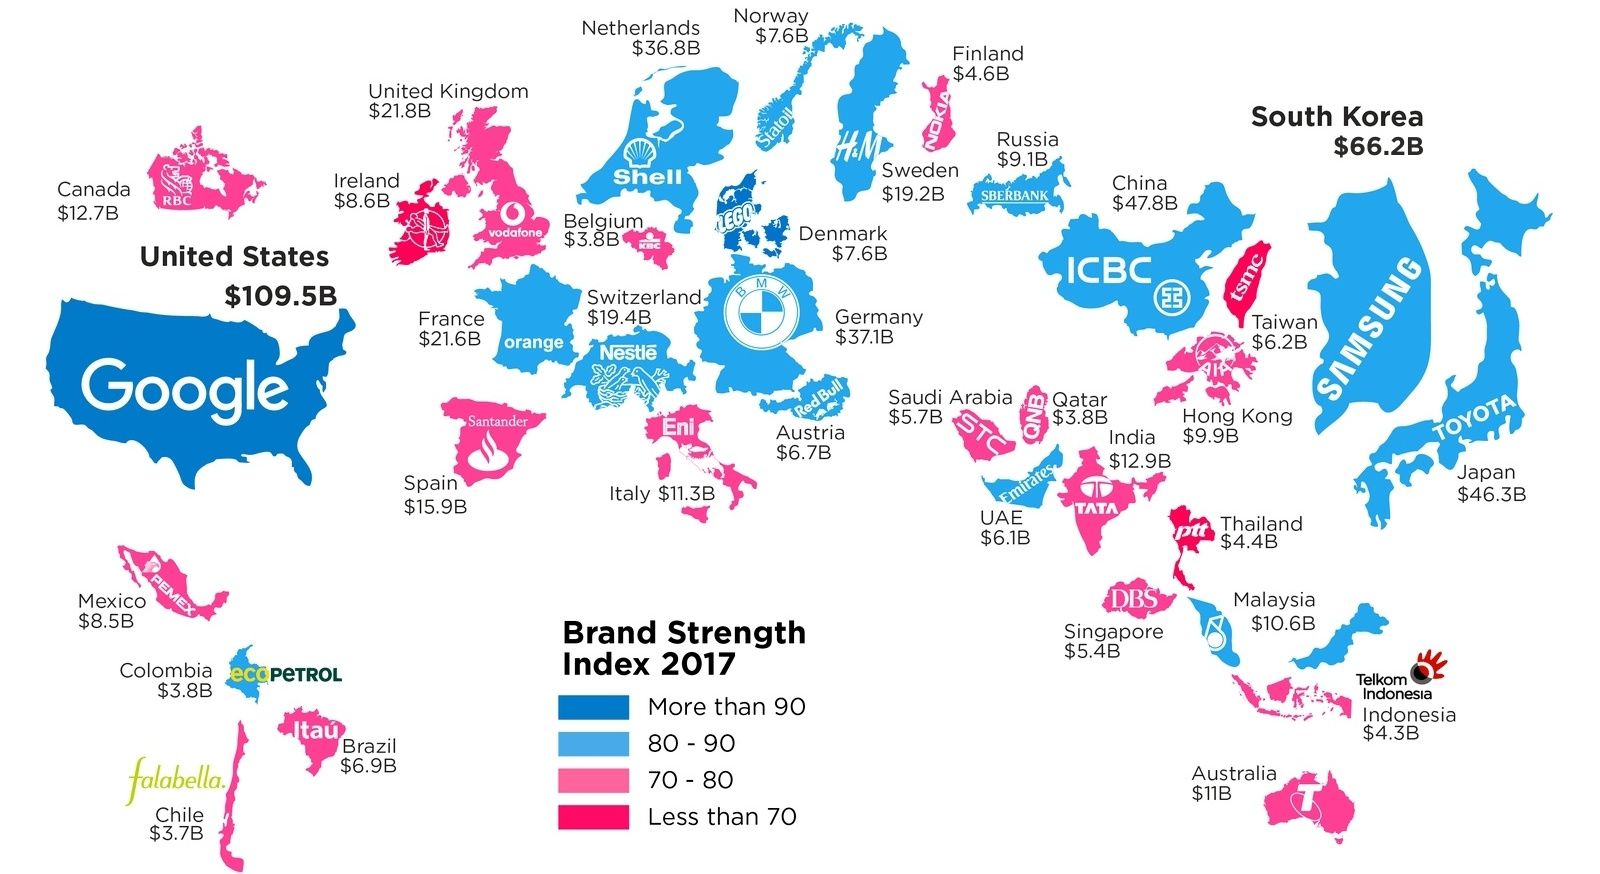
What is a top brand worth? This infographic highlights the most valuable brand in each country, according to the 2017 Brand Finance report.
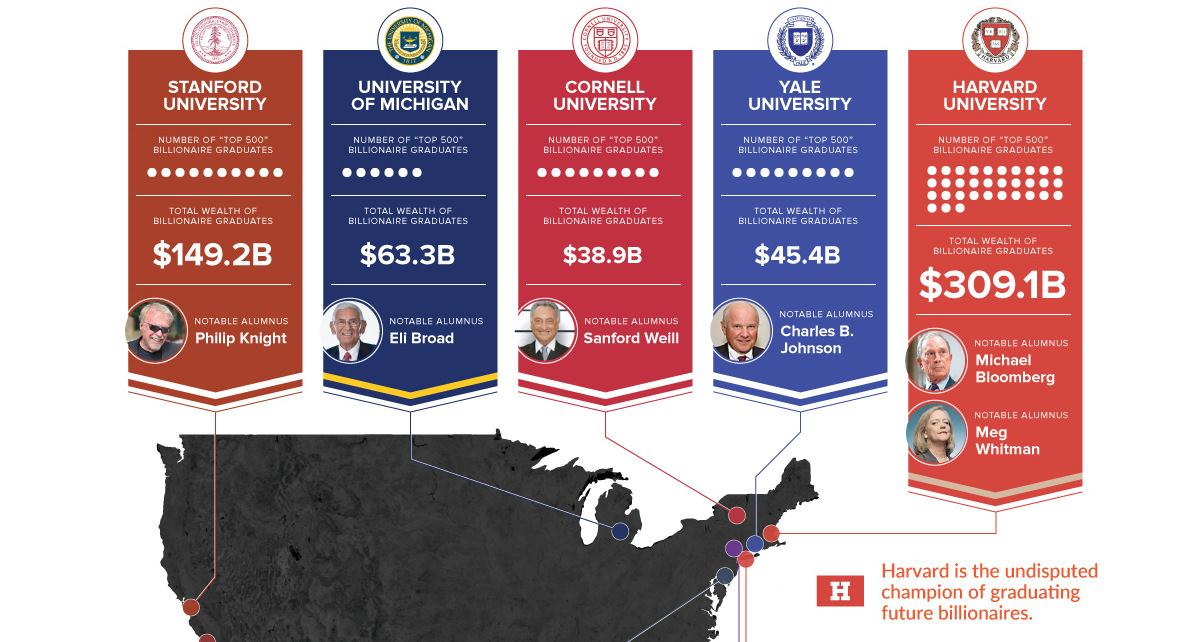
More billionaires graduated from Harvard than those hailing from Saudi Arabia and Spain combined. That makes it Billionaire University.
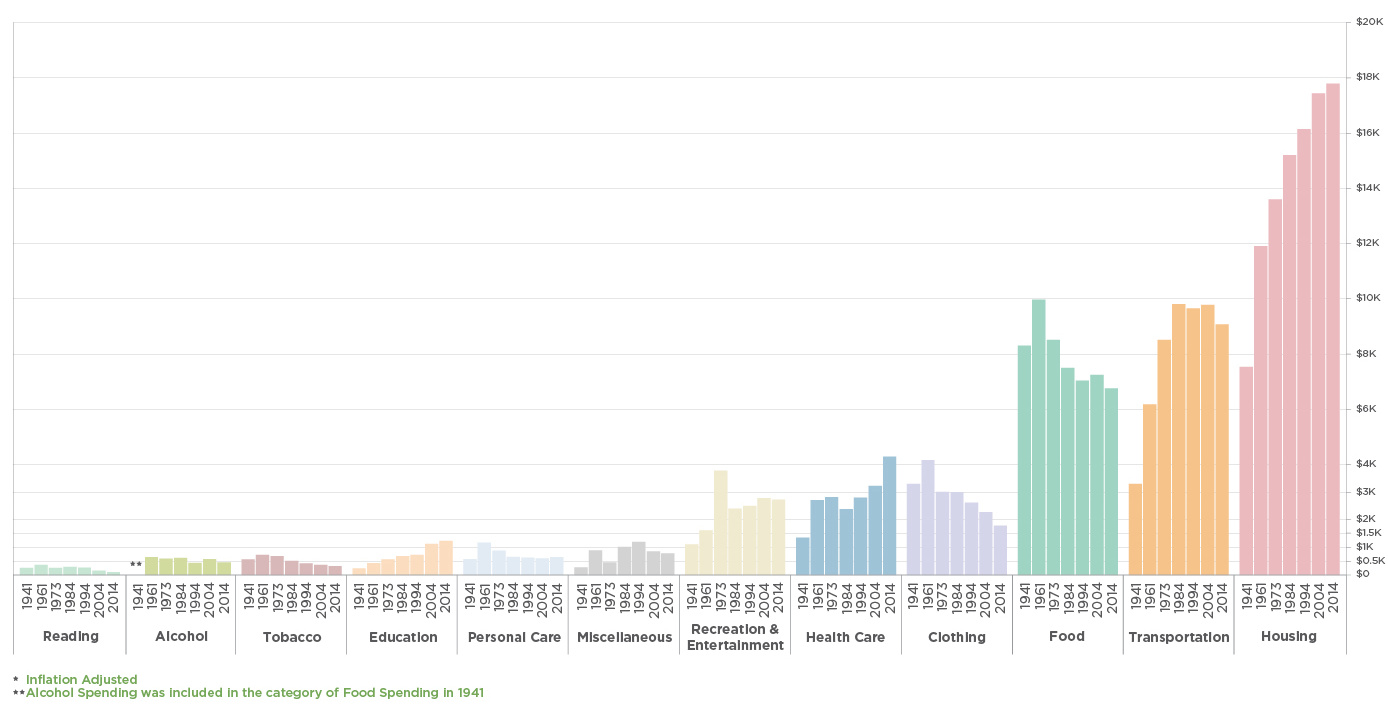
Consumers are the foundation of the economy, and how they spend money is telling. See what's changed with how Americans spend their money over the years.
Want to know how much money the government has borrowed on your behalf? This infographic shows government debt per capita for every country in the world.
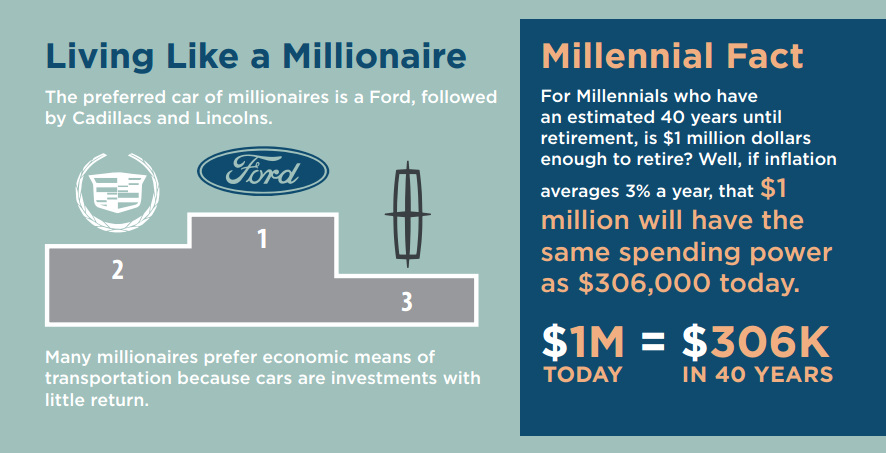
The preferred car for millionaires is a Ford, and most millionaires expect to continue working all the way until retirement.
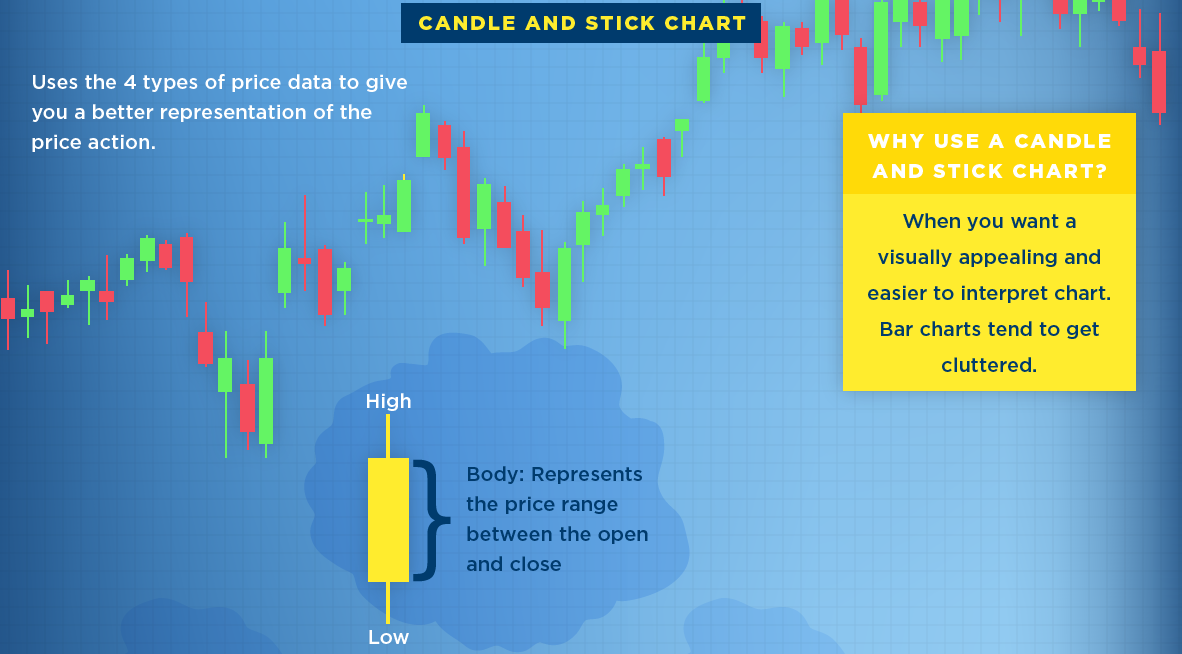
What is a stock chart? Here's three of the most common types of stock charts, along with a description of the data they typically provide investors.
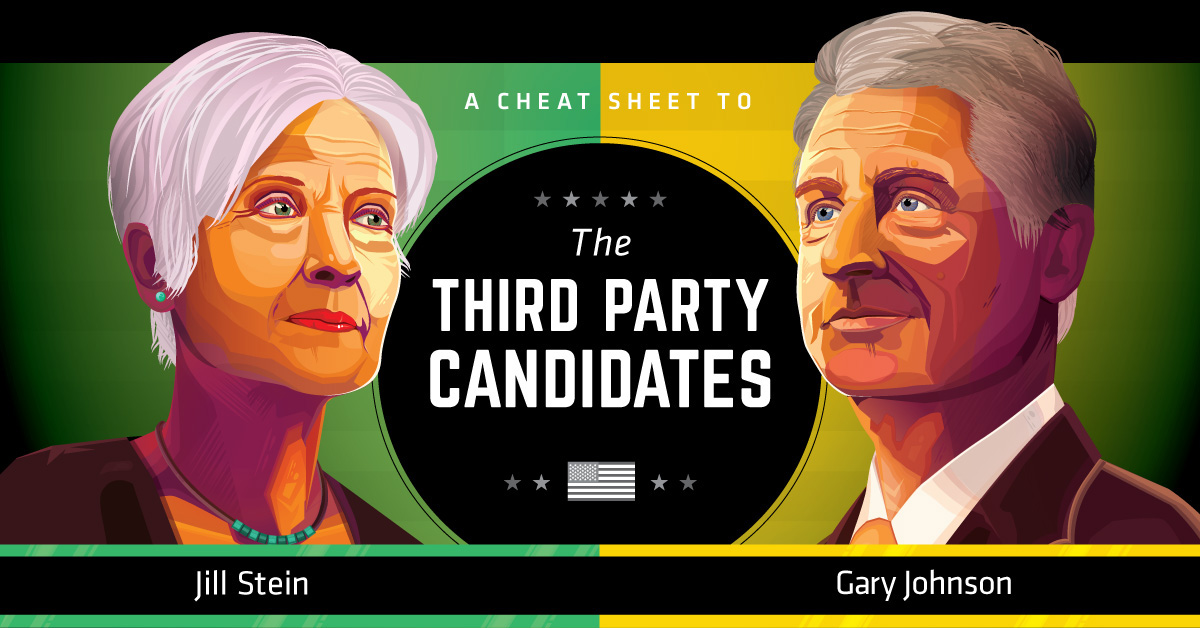
This infographic serves as a cheat sheet to the third party candidates in the U.S. Election, covering what Gary Johnson and Jill Stein are all about.
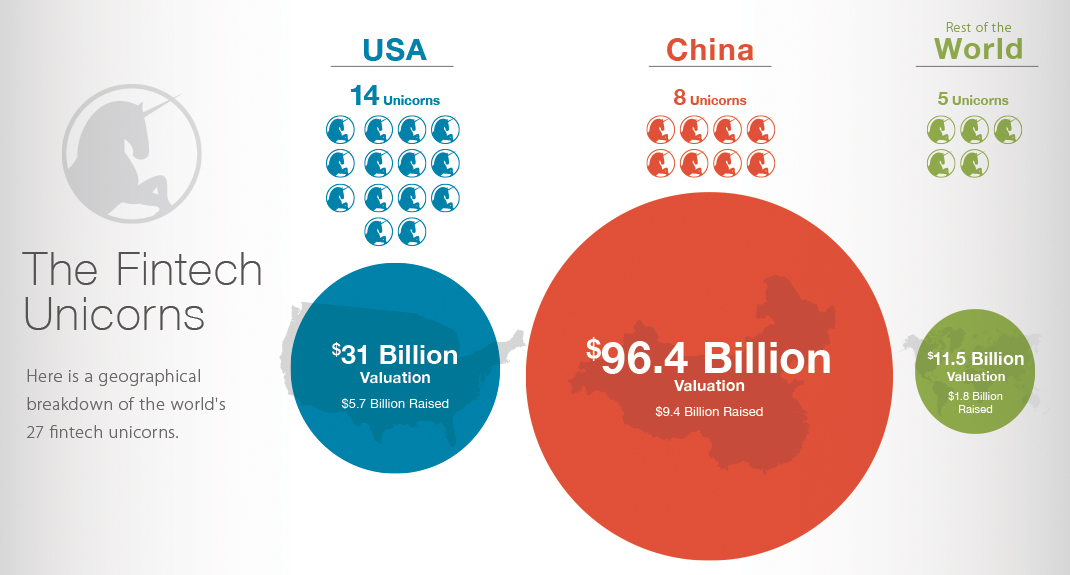
Does the U.S. or China have more valuable fintech startups? This data visualization breaks down fintech unicorns by valuations, money raised, and location.
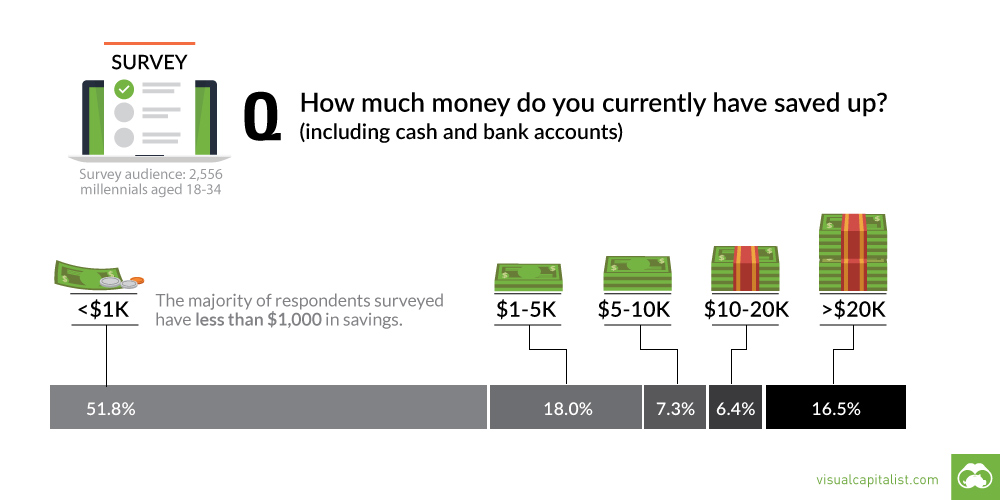
A recent survey shows that most millennials are living paycheck to paycheck. This chart looks at their savings, as well as differences between subgroups.