Money
Chart: Harvard is Billionaire University
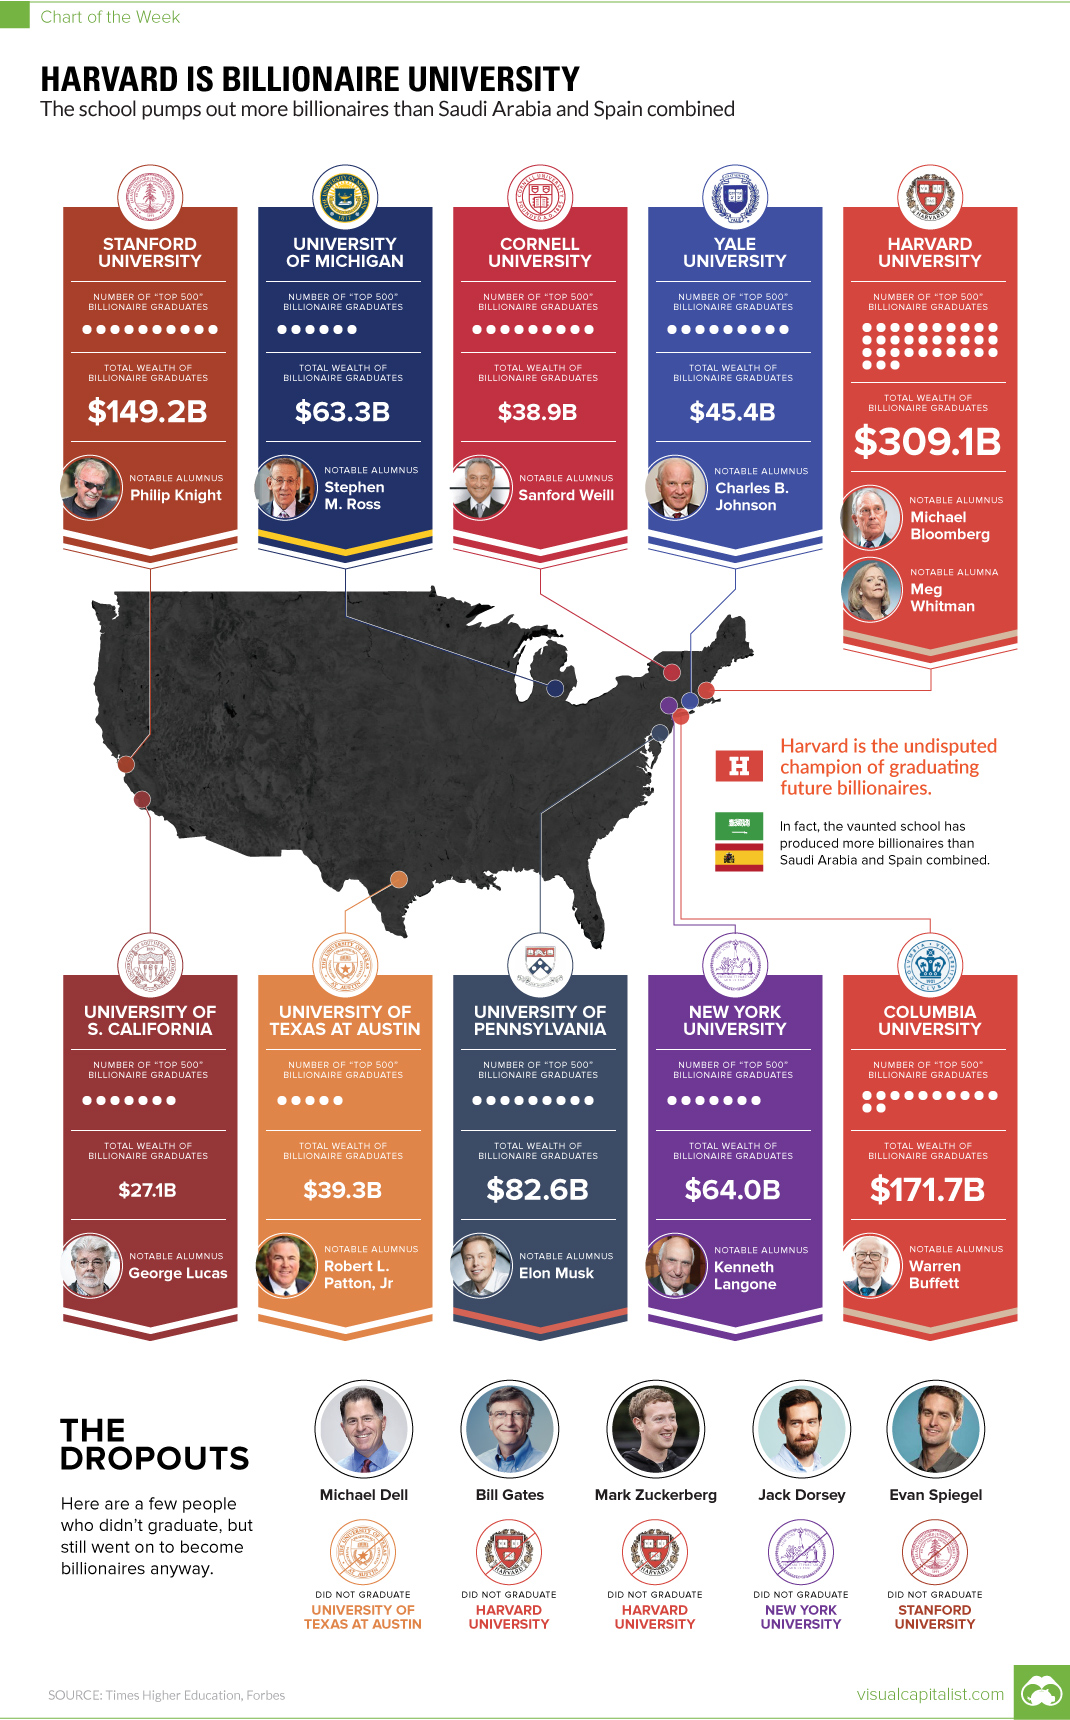
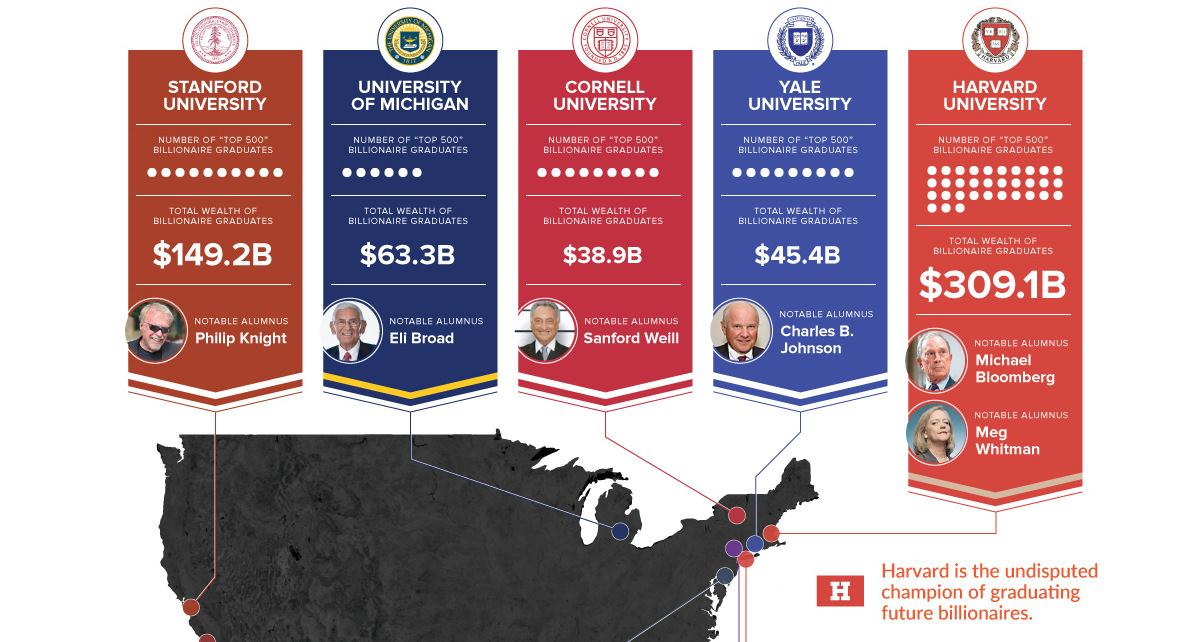
Harvard is Billionaire University
The school pumps out more billionaires than Saudi Arabia and Spain combined.
The Chart of the Week is a weekly Visual Capitalist feature on Fridays.
Want to learn about the history of economics, how to code with Ruby on Rails, or the essentials of string theory? It’s all out there for free on the internet, and anyone who has the time or energy can learn it directly from the experts.
The Information Age grants us an unprecedented amount of access to the world’s knowledge – and some thinkers like James Altucher or Peter Thiel see this leading to a path where the role of colleges and universities will continue to diminish.
We share that sentiment. The most recent crop of successful entrepreneurs like Evan Spiegel or Mark Zuckerberg already proves that entrepreneurs can make billions without spending a full four years in the classroom. The forthcoming generation will be even less tied to attending brick-and-mortar institutions.
There’s one caveat to this line of thought, however, and it coincides with this week’s chart. While one can say that the actual academic value of these institutions may be undermined by access to the digital world, the value of these as places to “rub shoulders” with up-and-comers still remains entrenched.
A Billionaire Making Machine
Talk to any successful person in business and they will tell you that developing a strong network is half of the battle. As far as schools go, Harvard is the perfect example of the “network effect” at work.
To date, a total of 35 of the richest 500 people in the world have emerged from the storied halls of Harvard. In fact, more billionaires have graduated from Harvard than all of those hailing from Saudi Arabia and Spain combined.
The total net worth of the top 35 Harvard billionaire graduates? It’s $309 billion – roughly equivalent to the GDP of Hong Kong or Ireland. With alumni like Charlie Munger, Meg Whitman, John Paulson, Steve Ballmer, Paul Singer, Ken Griffin, Ray Dalio, and Michael Bloomberg among the ranks of Harvard graduates, it’s a powerful hub to tap into. Today’s Harvard students and professors take advantage of this prestigious network every day.
Elite universities still serve as filtering mechanisms that only bring in students that are smart, well-connected, or both. Top schools like Stanford or Harvard have acceptance rates less than 6%, and this exclusivity gives graduating students a connected and privileged network from the get-go.
One hundred years from now, will these institutions still have the same track records from the exclusivity factor alone? It remains to be seen, but for now they are still undisputed billionaire making machines until proven otherwise.


Money
Charted: Which City Has the Most Billionaires in 2024?
Just two countries account for half of the top 20 cities with the most billionaires. And the majority of the other half are found in Asia.


Charted: Which Country Has the Most Billionaires in 2024?
This was originally posted on our Voronoi app. Download the app for free on iOS or Android and discover incredible data-driven charts from a variety of trusted sources.
Some cities seem to attract the rich. Take New York City for example, which has 340,000 high-net-worth residents with investable assets of more than $1 million.
But there’s a vast difference between being a millionaire and a billionaire. So where do the richest of them all live?
Using data from the Hurun Global Rich List 2024, we rank the top 20 cities with the highest number of billionaires in 2024.
A caveat to these rich lists: sources often vary on figures and exact rankings. For example, in last year’s reports, Forbes had New York as the city with the most billionaires, while the Hurun Global Rich List placed Beijing at the top spot.
Ranked: Top 20 Cities with the Most Billionaires in 2024
The Chinese economy’s doldrums over the course of the past year have affected its ultra-wealthy residents in key cities.
Beijing, the city with the most billionaires in 2023, has not only ceded its spot to New York, but has dropped to #4, overtaken by London and Mumbai.
| Rank | City | Billionaires | Rank Change YoY |
|---|---|---|---|
| 1 | 🇺🇸 New York | 119 | +1 |
| 2 | 🇬🇧 London | 97 | +3 |
| 3 | 🇮🇳 Mumbai | 92 | +4 |
| 4 | 🇨🇳 Beijing | 91 | -3 |
| 5 | 🇨🇳 Shanghai | 87 | -2 |
| 6 | 🇨🇳 Shenzhen | 84 | -2 |
| 7 | 🇭🇰 Hong Kong | 65 | -1 |
| 8 | 🇷🇺 Moscow | 59 | No Change |
| 9 | 🇮🇳 New Delhi | 57 | +6 |
| 10 | 🇺🇸 San Francisco | 52 | No Change |
| 11 | 🇹🇭 Bangkok | 49 | +2 |
| 12 | 🇹🇼 Taipei | 45 | +2 |
| 13 | 🇫🇷 Paris | 44 | -2 |
| 14 | 🇨🇳 Hangzhou | 43 | -5 |
| 15 | 🇸🇬 Singapore | 42 | New to Top 20 |
| 16 | 🇨🇳 Guangzhou | 39 | -4 |
| 17T | 🇮🇩 Jakarta | 37 | +1 |
| 17T | 🇧🇷 Sao Paulo | 37 | No Change |
| 19T | 🇺🇸 Los Angeles | 31 | No Change |
| 19T | 🇰🇷 Seoul | 31 | -3 |
In fact all Chinese cities on the top 20 list have lost billionaires between 2023–24. Consequently, they’ve all lost ranking spots as well, with Hangzhou seeing the biggest slide (-5) in the top 20.
Where China lost, all other Asian cities—except Seoul—in the top 20 have gained ranks. Indian cities lead the way, with New Delhi (+6) and Mumbai (+3) having climbed the most.
At a country level, China and the U.S combine to make up half of the cities in the top 20. They are also home to about half of the world’s 3,200 billionaire population.
In other news of note: Hurun officially counts Taylor Swift as a billionaire, estimating her net worth at $1.2 billion.

-

 Mining1 week ago
Gold vs. S&P 500: Which Has Grown More Over Five Years?
-

 Markets2 weeks ago
Ranked: The Most Valuable Housing Markets in America
-

 Money2 weeks ago
Which States Have the Highest Minimum Wage in America?
-

 AI2 weeks ago
Ranked: Semiconductor Companies by Industry Revenue Share
-

 Markets2 weeks ago
Ranked: The World’s Top Flight Routes, by Revenue
-

 Countries2 weeks ago
Population Projections: The World’s 6 Largest Countries in 2075
-

 Markets2 weeks ago
The Top 10 States by Real GDP Growth in 2023
-

 Demographics2 weeks ago
The Smallest Gender Wage Gaps in OECD Countries