Comparing Saudi Aramco’s $1.9T Valuation to Its Rivals
The Top Retailers in the World, by Store Count
Visualizing Berkshire Hathaway’s Stock Portfolio (Q1 2024)
Nvidia is Worth More Than All of These Companies Combined
Which Retailers Operate in the Most Countries?
What Laptop Brands do Americans Use in 2024?
Ranked: The Top Startup Cities Around the World
Visualizing the 5 Most Common Cybersecurity Mistakes
Countries With the Highest Rates of Crypto Ownership
Mapped: The Income a Family Needs to Live Comfortably in Every U.S. State
Top 10 Countries Most in Debt to the IMF
Visualizing America’s Average Retirement Savings, by Age
Visualizing the Tax Burden of Every U.S. State
Charted: What Frustrates Americans About the Tax System
Visualizing Daily Protein Sources by Region
Mapped: Countries Where Recreational Cannabis is Legal
Which Countries Have the Highest Infant Mortality Rates?
Life Expectancy by Region (1950-2050F)
What Causes Preventable Child Deaths?
Ranked: The World’s Largest Lithium Producers in 2023
Who’s Building the Most Solar Energy?
Mapped: The Age of Energy Projects in Interconnection Queues, by State
Ranked: The Top 10 EV Battery Manufacturers in 2023
Mapped: The World’s Largest Armies in 2024
Mapped: Chinese Provinces With Cities Over 1 Million People
Map: Where Are America’s Largest Landfills?
Mapped: The World’s Wettest and Driest Countries
Visualizing Cobalt Production by Country in 2023
The Biggest Salt Producing Countries in 2023
Visualizing Copper Production by Country in 2023
Where the World’s Aluminum is Smelted, by Country
How People Get Around in America, Europe, and Asia
The Carbon Footprint of Major Travel Methods
Ranking the Top 15 Countries by Carbon Tax Revenue
Ranked: The Countries With the Most Air Pollution in 2023
Top Countries By Forest Growth Since 2001
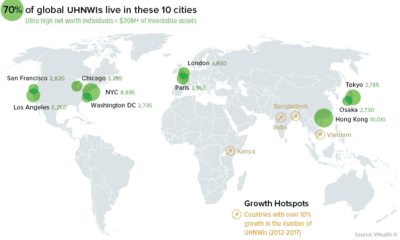
A data-driven snapshot of global wealth distribution. The average person around the world is doing better, but big-picture inequality is still staggering.
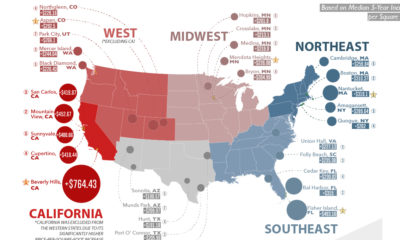
Here are the biggest increases in median housing prices (per sq. ft) over the last 5 years. See where real estate prices are rising (and falling)...
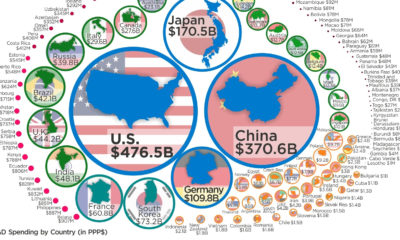
Just four countries (U.S., China, Japan, and Germany) account for nearly two-thirds of global expenditures on R&D. Here's global data on R&D visualized.
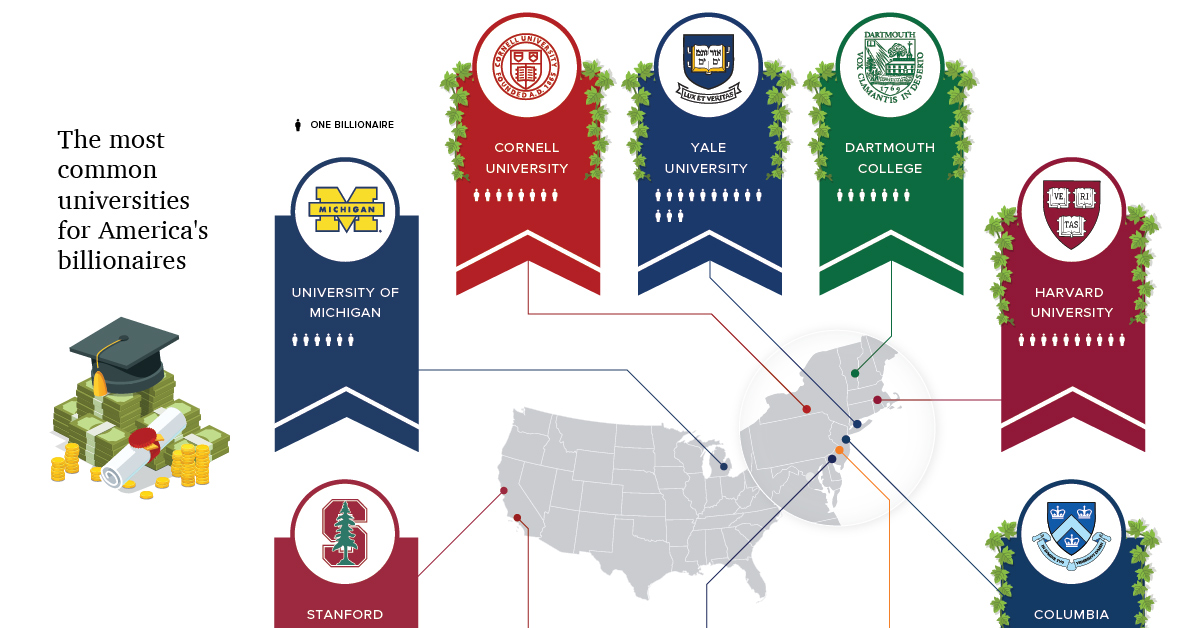
Even billionaires need to start somewhere - and often that's with a college education. See which colleges produce the most American billionaires.
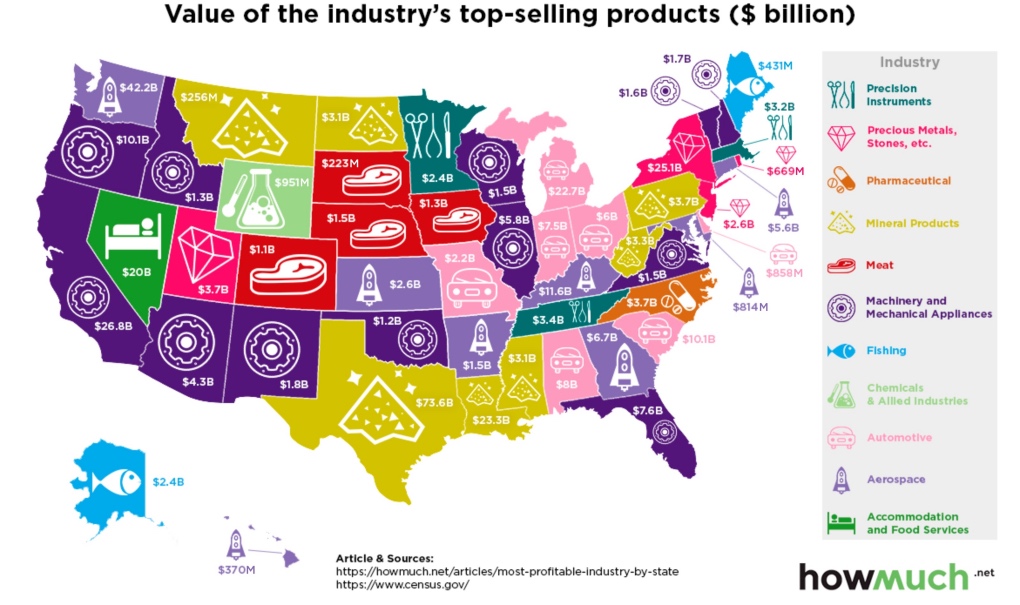
Which industries reign supreme in the United States? This map breaks down the most profitable industry, state by state.
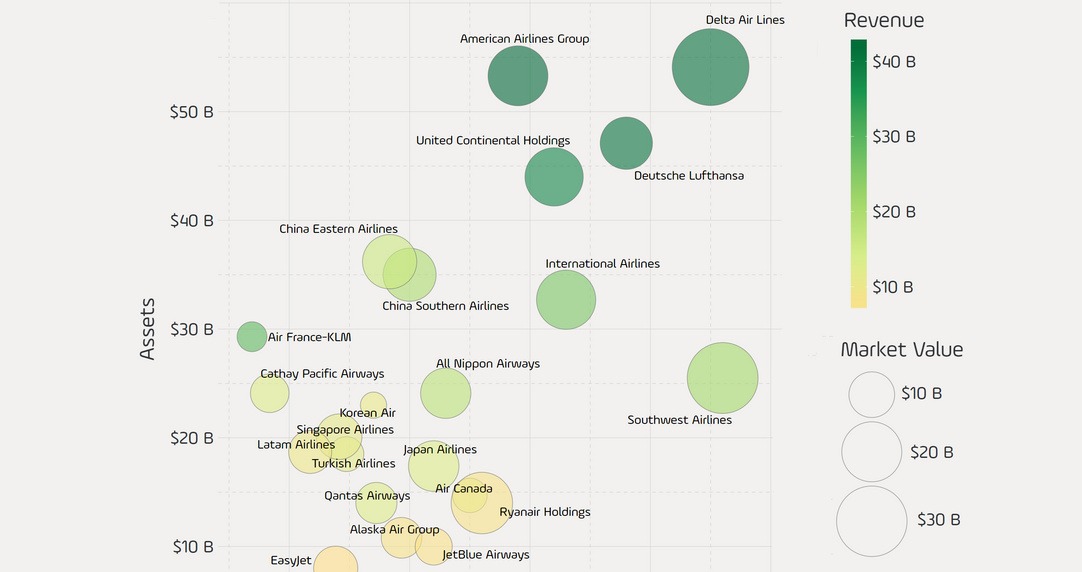
Comparing the largest public-traded airline companies in the world, based on revenue, profit, assets, and market capitalization.
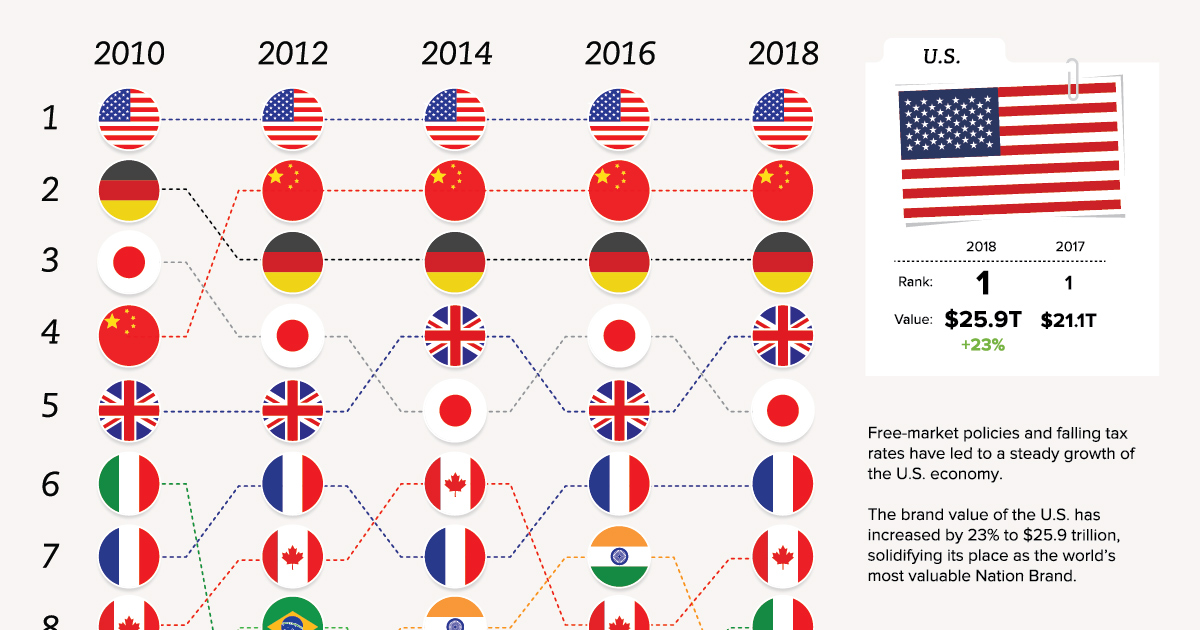
In a global marketplace, a country's national image can be one of its most valued assets or a challenging liability. See how nation brands do in...
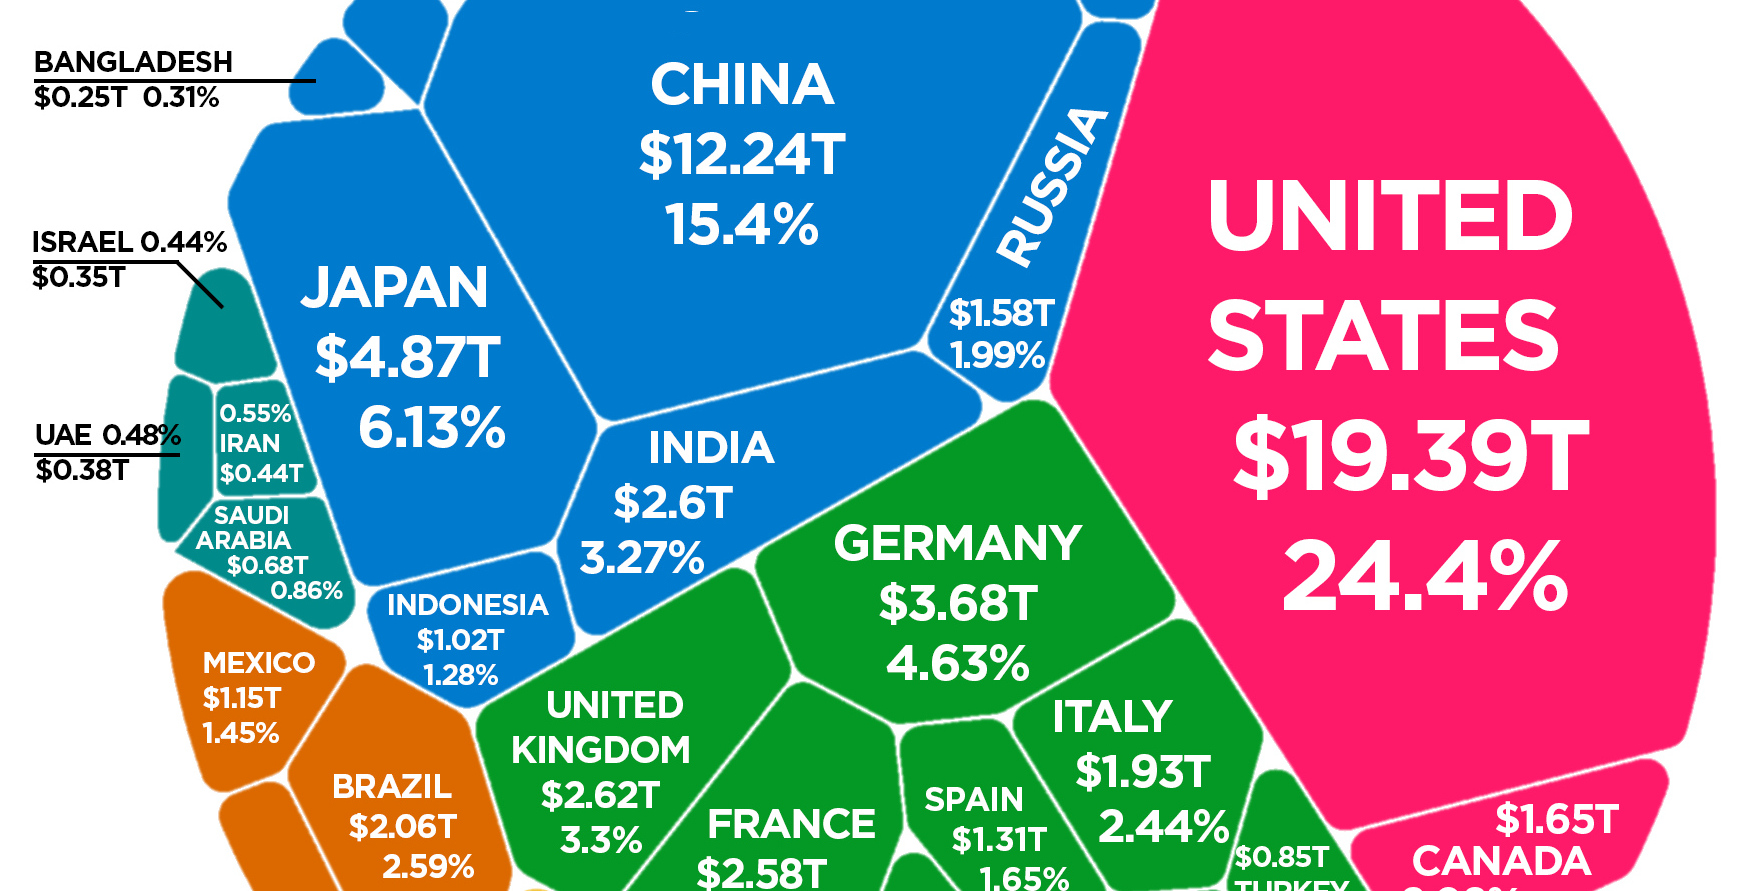
Latest estimates put the world economy at about $80 trillion in nominal GDP. Here is how each individual country stacks up in terms of size.
Which countries receive the most money from international tourism? Each country is resized on this map based on dollars coming in from travelers.
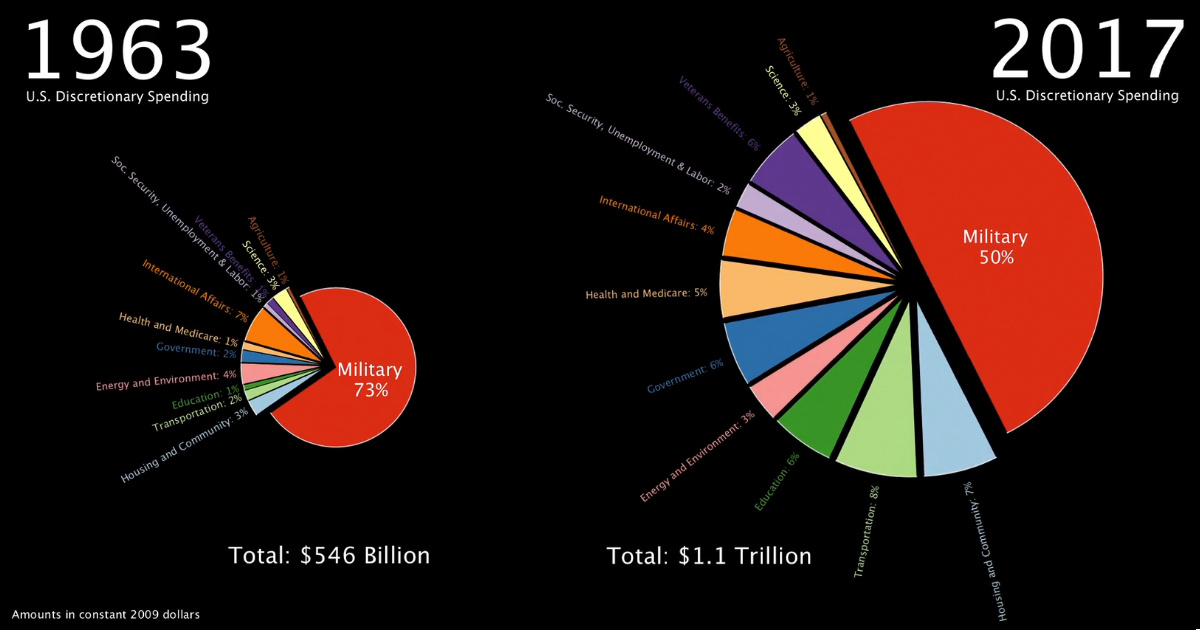
This stunning one minute animation breaks down U.S. government discretionary spending from 1963 all the way until today.