Energy
Mapped: Solar and Wind Power by Country
![]() Subscribe to the Elements free mailing list for more like this
Subscribe to the Elements free mailing list for more like this


Mapped: Solar and Wind Power by Country
This was originally posted on Elements. Sign up to the free mailing list to get beautiful visualizations on natural resource megatrends in your email every week.
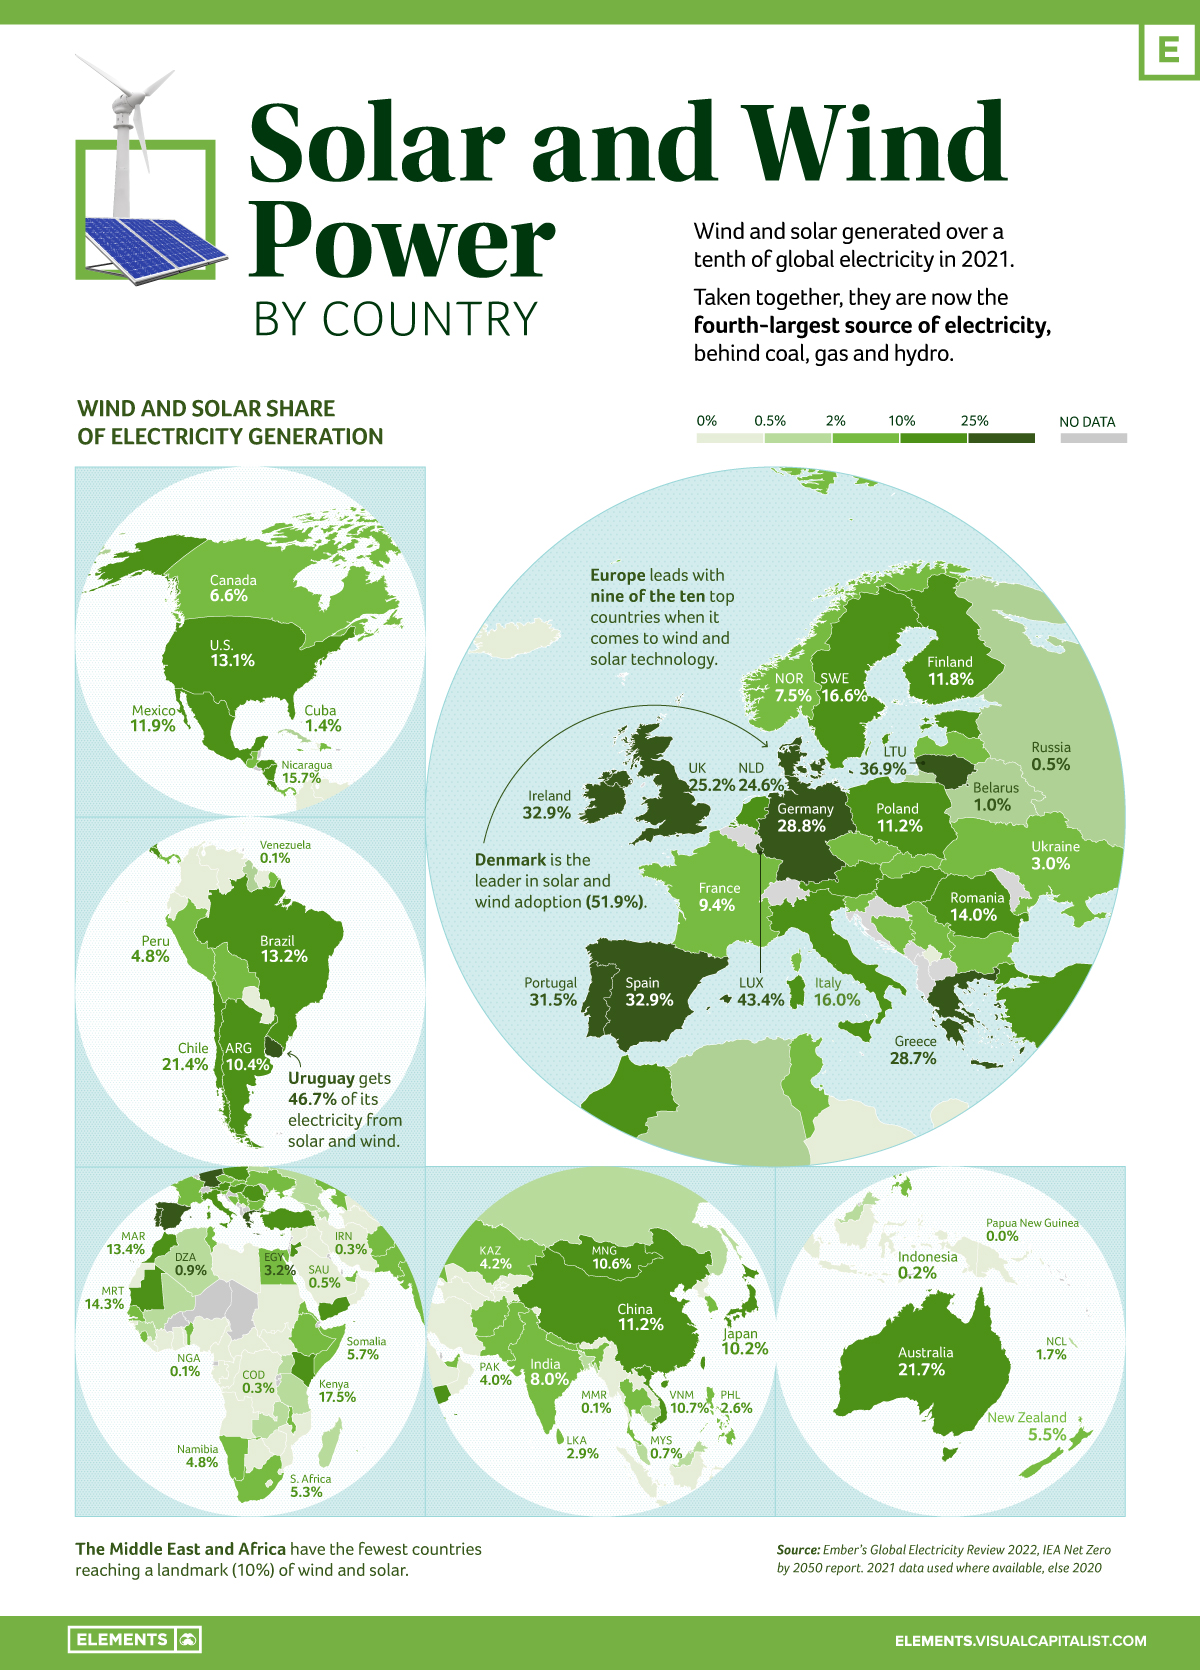
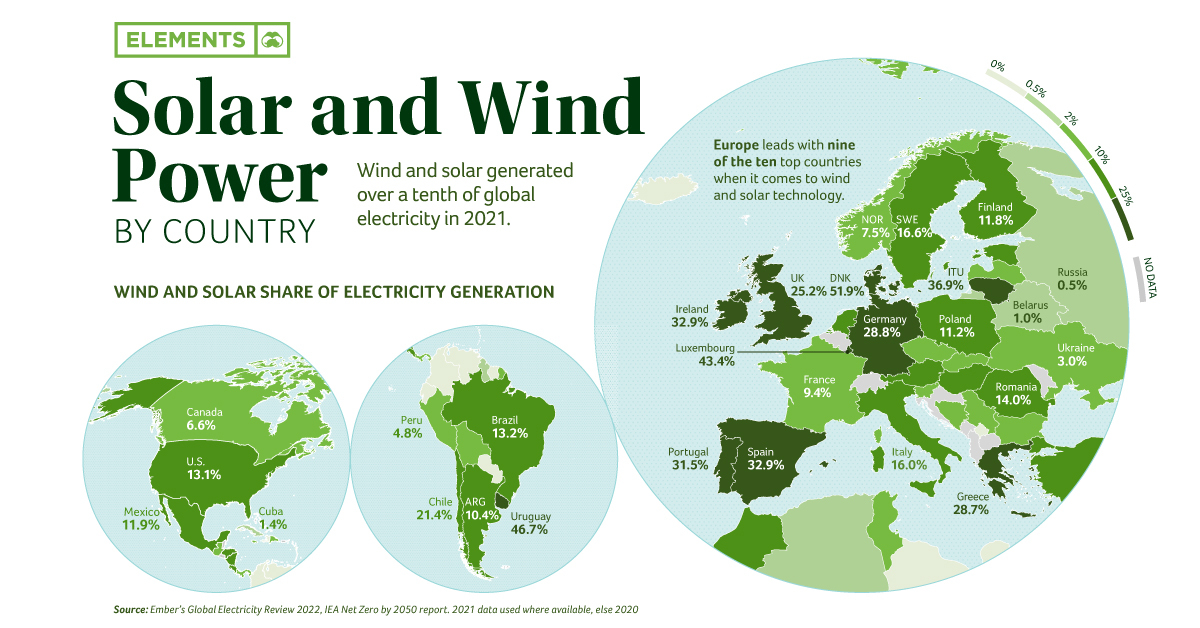
Wind and solar generate over a tenth of the world’s electricity. Taken together, they are the fourth-largest source of electricity, behind coal, gas, and hydro.
This infographic based on data from Ember shows the rise of electricity from these two clean sources over the last decade.
Europe Leads in Wind and Solar
Wind and solar generated 10.3% of global electricity for the first time in 2021, rising from 9.3% in 2020, and doubling their share compared to 2015 when the Paris Climate Agreement was signed.
In fact, 50 countries (26%) generated over a tenth of their electricity from wind and solar in 2021, with seven countries hitting this landmark for the first time: China, Japan, Mongolia, Vietnam, Argentina, Hungary, and El Salvador.
Denmark and Uruguay achieved 52% and 47% respectively, leading the way in technology for high renewable grid integration.
| Rank | Top Countries | Solar/Wind Power Share |
|---|---|---|
| #1 | 🇩🇰 Denmark | 51.9% |
| #2 | 🇺🇾 Uruguay | 46.7% |
| #3 | 🇱🇺 Luxembourg | 43.4% |
| #4 | 🇱🇹 Lithuania | 36.9% |
| #5 | 🇪🇸 Spain | 32.9% |
| #6 | 🇮🇪 Ireland | 32.9% |
| #7 | 🇵🇹 Portugal | 31.5% |
| #8 | 🇩🇪 Germany | 28.8% |
| #9 | 🇬🇷 Greece | 28.7% |
| #10 | 🇬🇧 United Kingdom | 25.2% |
From a regional perspective, Europe leads with nine of the top 10 countries. On the flipside, the Middle East and Africa have the fewest countries reaching the 10% threshold.
Further Renewables Growth Needed to meet Global Climate Goals
The electricity sector was the highest greenhouse gas emitting sector in 2020.
According to the International Energy Agency (IEA), the sector needs to hit net zero globally by 2040 to achieve the Paris Agreement’s goals of limiting global heating to 1.5 degrees. And to hit that goal, wind and solar power need to grow at nearly a 20% clip each year to 2030.
Despite the record rise in renewables, solar and wind electricity generation growth currently doesn’t meet the required marks to reach the Paris Agreement’s goals.
In fact, when the world faced an unprecedented surge in electricity demand in 2021, only 29% of the global rise in electricity demand was met with solar and wind.
Transition Underway
Even as emissions from the electricity sector are at an all-time high, there are signs that the global electricity transition is underway.
Governments like the U.S., Germany, UK, and Canada are planning to increase their share of clean electricity within the next decade and a half. Investments are also coming from the private sector, with companies like Amazon and Apple extending their positions on renewable energy to become some of the biggest buyers overall.
More wind and solar are being added to grids than ever, with renewables expected to provide the majority of clean electricity needed to phase out fossil fuels.


Batteries
Ranked: The World’s Largest Lithium Producers in 2023
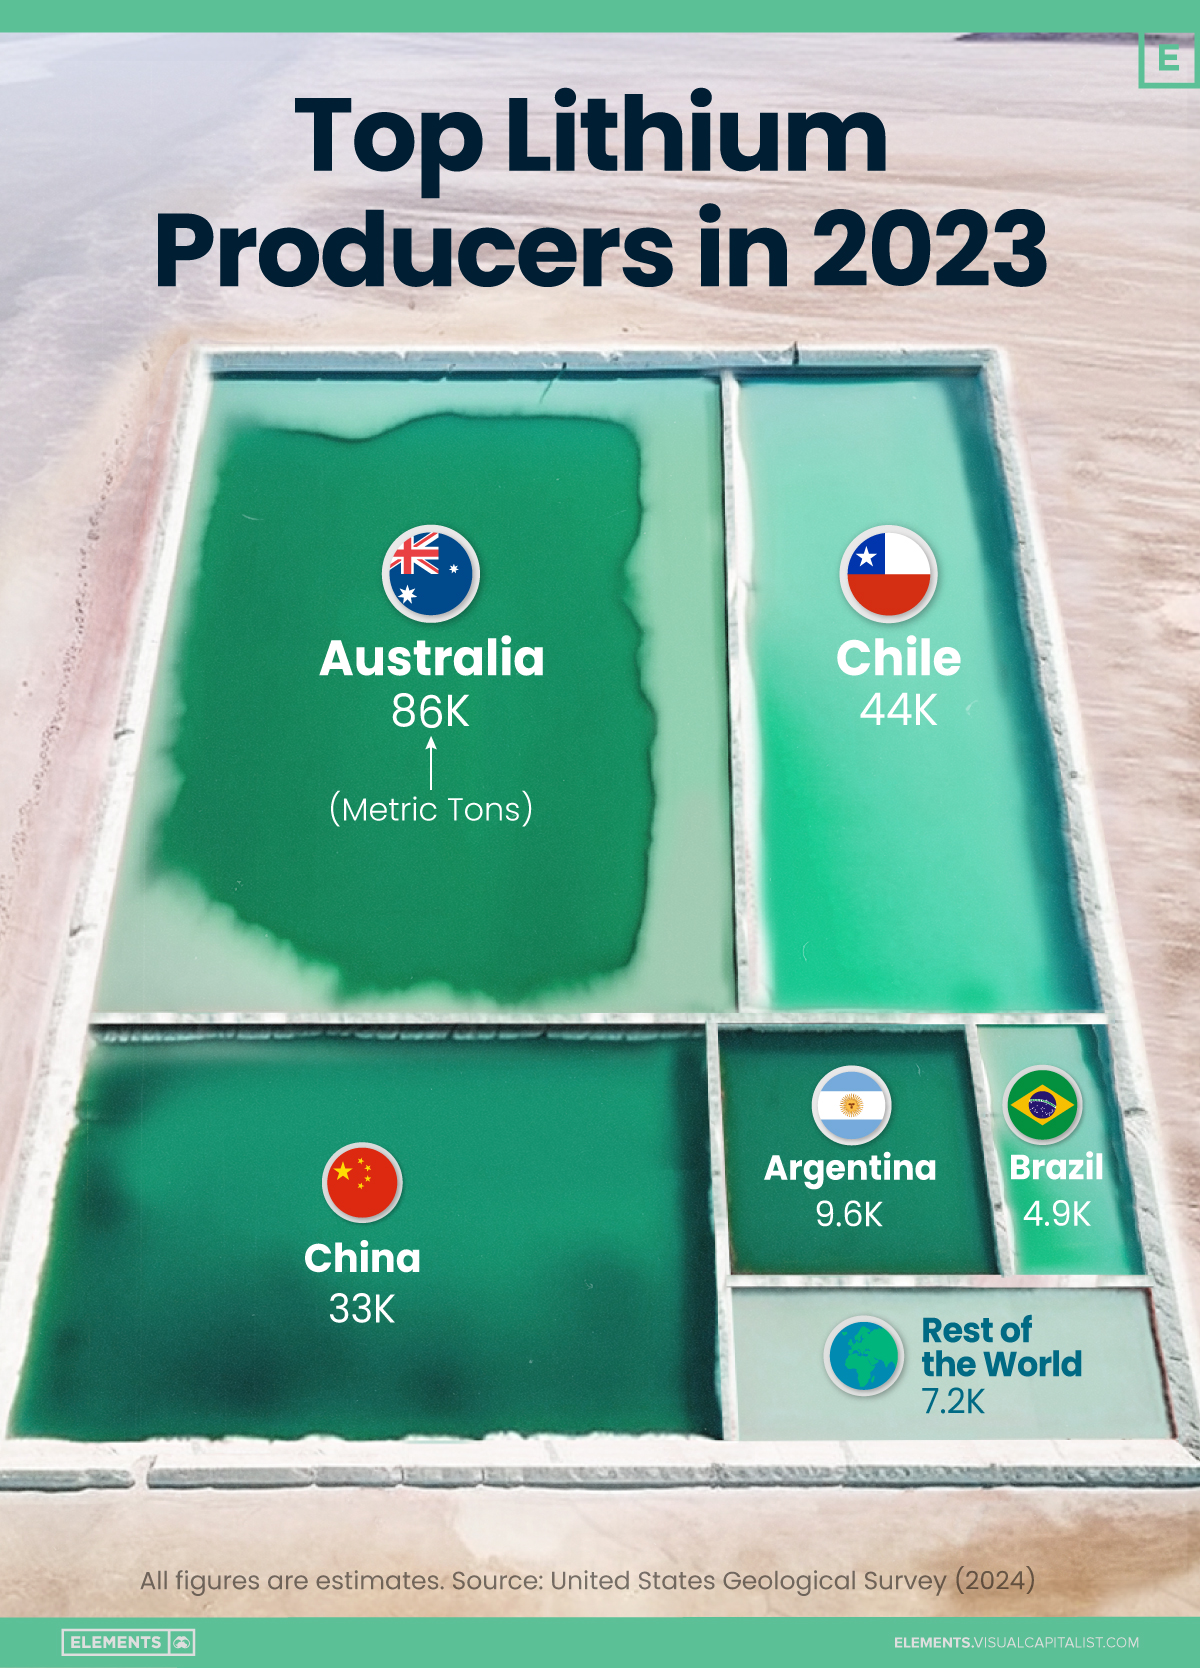
Three countries account for almost 90% of the lithium produced in the world.
The World’s Largest Lithium Producers in 2023
This was originally posted on our Voronoi app. Download the app for free on iOS or Android and discover incredible data-driven charts from a variety of trusted sources.
Three countries—Australia, Chile, and China—accounted for 88% of lithium production in 2023.
In this graphic, we list the world’s leading countries in terms of lithium production. These figures come from the latest USGS publication on lithium statistics (published Jan 2024).
Australia Leads, China Approaches Chile
Australia, the world’s leading producer, extracts lithium directly from hard-rock mines, specifically from the mineral spodumene.
The country saw a big jump in output over the last decade. In 2013, Australia produced 13,000 metric tons of lithium, compared to 86,000 metric tons in 2023.
| Rank | Country | Lithium production 2023E (metric tons) |
|---|---|---|
| 1 | 🇦🇺 Australia | 86,000 |
| 2 | 🇨🇱 Chile | 44,000 |
| 3 | 🇨🇳 China | 33,000 |
| 4 | 🇦🇷 Argentina | 9,600 |
| 5 | 🇧🇷 Brazil | 4,900 |
| 6 | 🇨🇦 Canada | 3,400 |
| 7 | 🇿🇼 Zimbabwe | 3,400 |
| 8 | 🇵🇹 Portugal | 380 |
| 🌍 World Total | 184,680 |
Chile is second in rank but with more modest growth. Chilean production rose from 13,500 tonnes in 2013 to 44,000 metric tons in 2023. Contrary to Australia, the South American country extracts lithium from brine.
China, which also produces lithium from brine, has been approaching Chile over the years. The country increased its domestic production from 4,000 metric tons in 2013 to 33,000 last year.
Chinese companies have also increased their ownership shares in lithium producers around the globe; three Chinese companies are also among the top lithium mining companies. The biggest, Tianqi Lithium, has a significant stake in Greenbushes, the world’s biggest hard-rock lithium mine in Australia.
Argentina, the fourth country on our list, more than tripled its production over the last decade and has received investments from other countries to increase its output.
With all the top producers increasing output to cover the demand from the clean energy industry, especially for electric vehicle (EV) batteries, the lithium market has seen a surplus recently, which caused prices to collapse by more than 80% from a late-2022 record high.

-

 Economy1 week ago
Mapped: The Top Exports in Asian Countries
-

 Maps2 weeks ago
Mapped: U.S. Immigrants by Region
-

 Healthcare2 weeks ago
Which Countries Have the Highest Infant Mortality Rates?
-

 Misc2 weeks ago
Charted: How Americans Feel About Federal Government Agencies
-

 Mining2 weeks ago
Visualizing Copper Production by Country in 2023
-

 Brands2 weeks ago
How Popular Snack Brand Logos Have Changed
-

 War2 weeks ago
Visualized: Aircraft Carriers by Country
-

 United States2 weeks ago
Mapped: Countries Where Recreational Cannabis is Legal