Misc
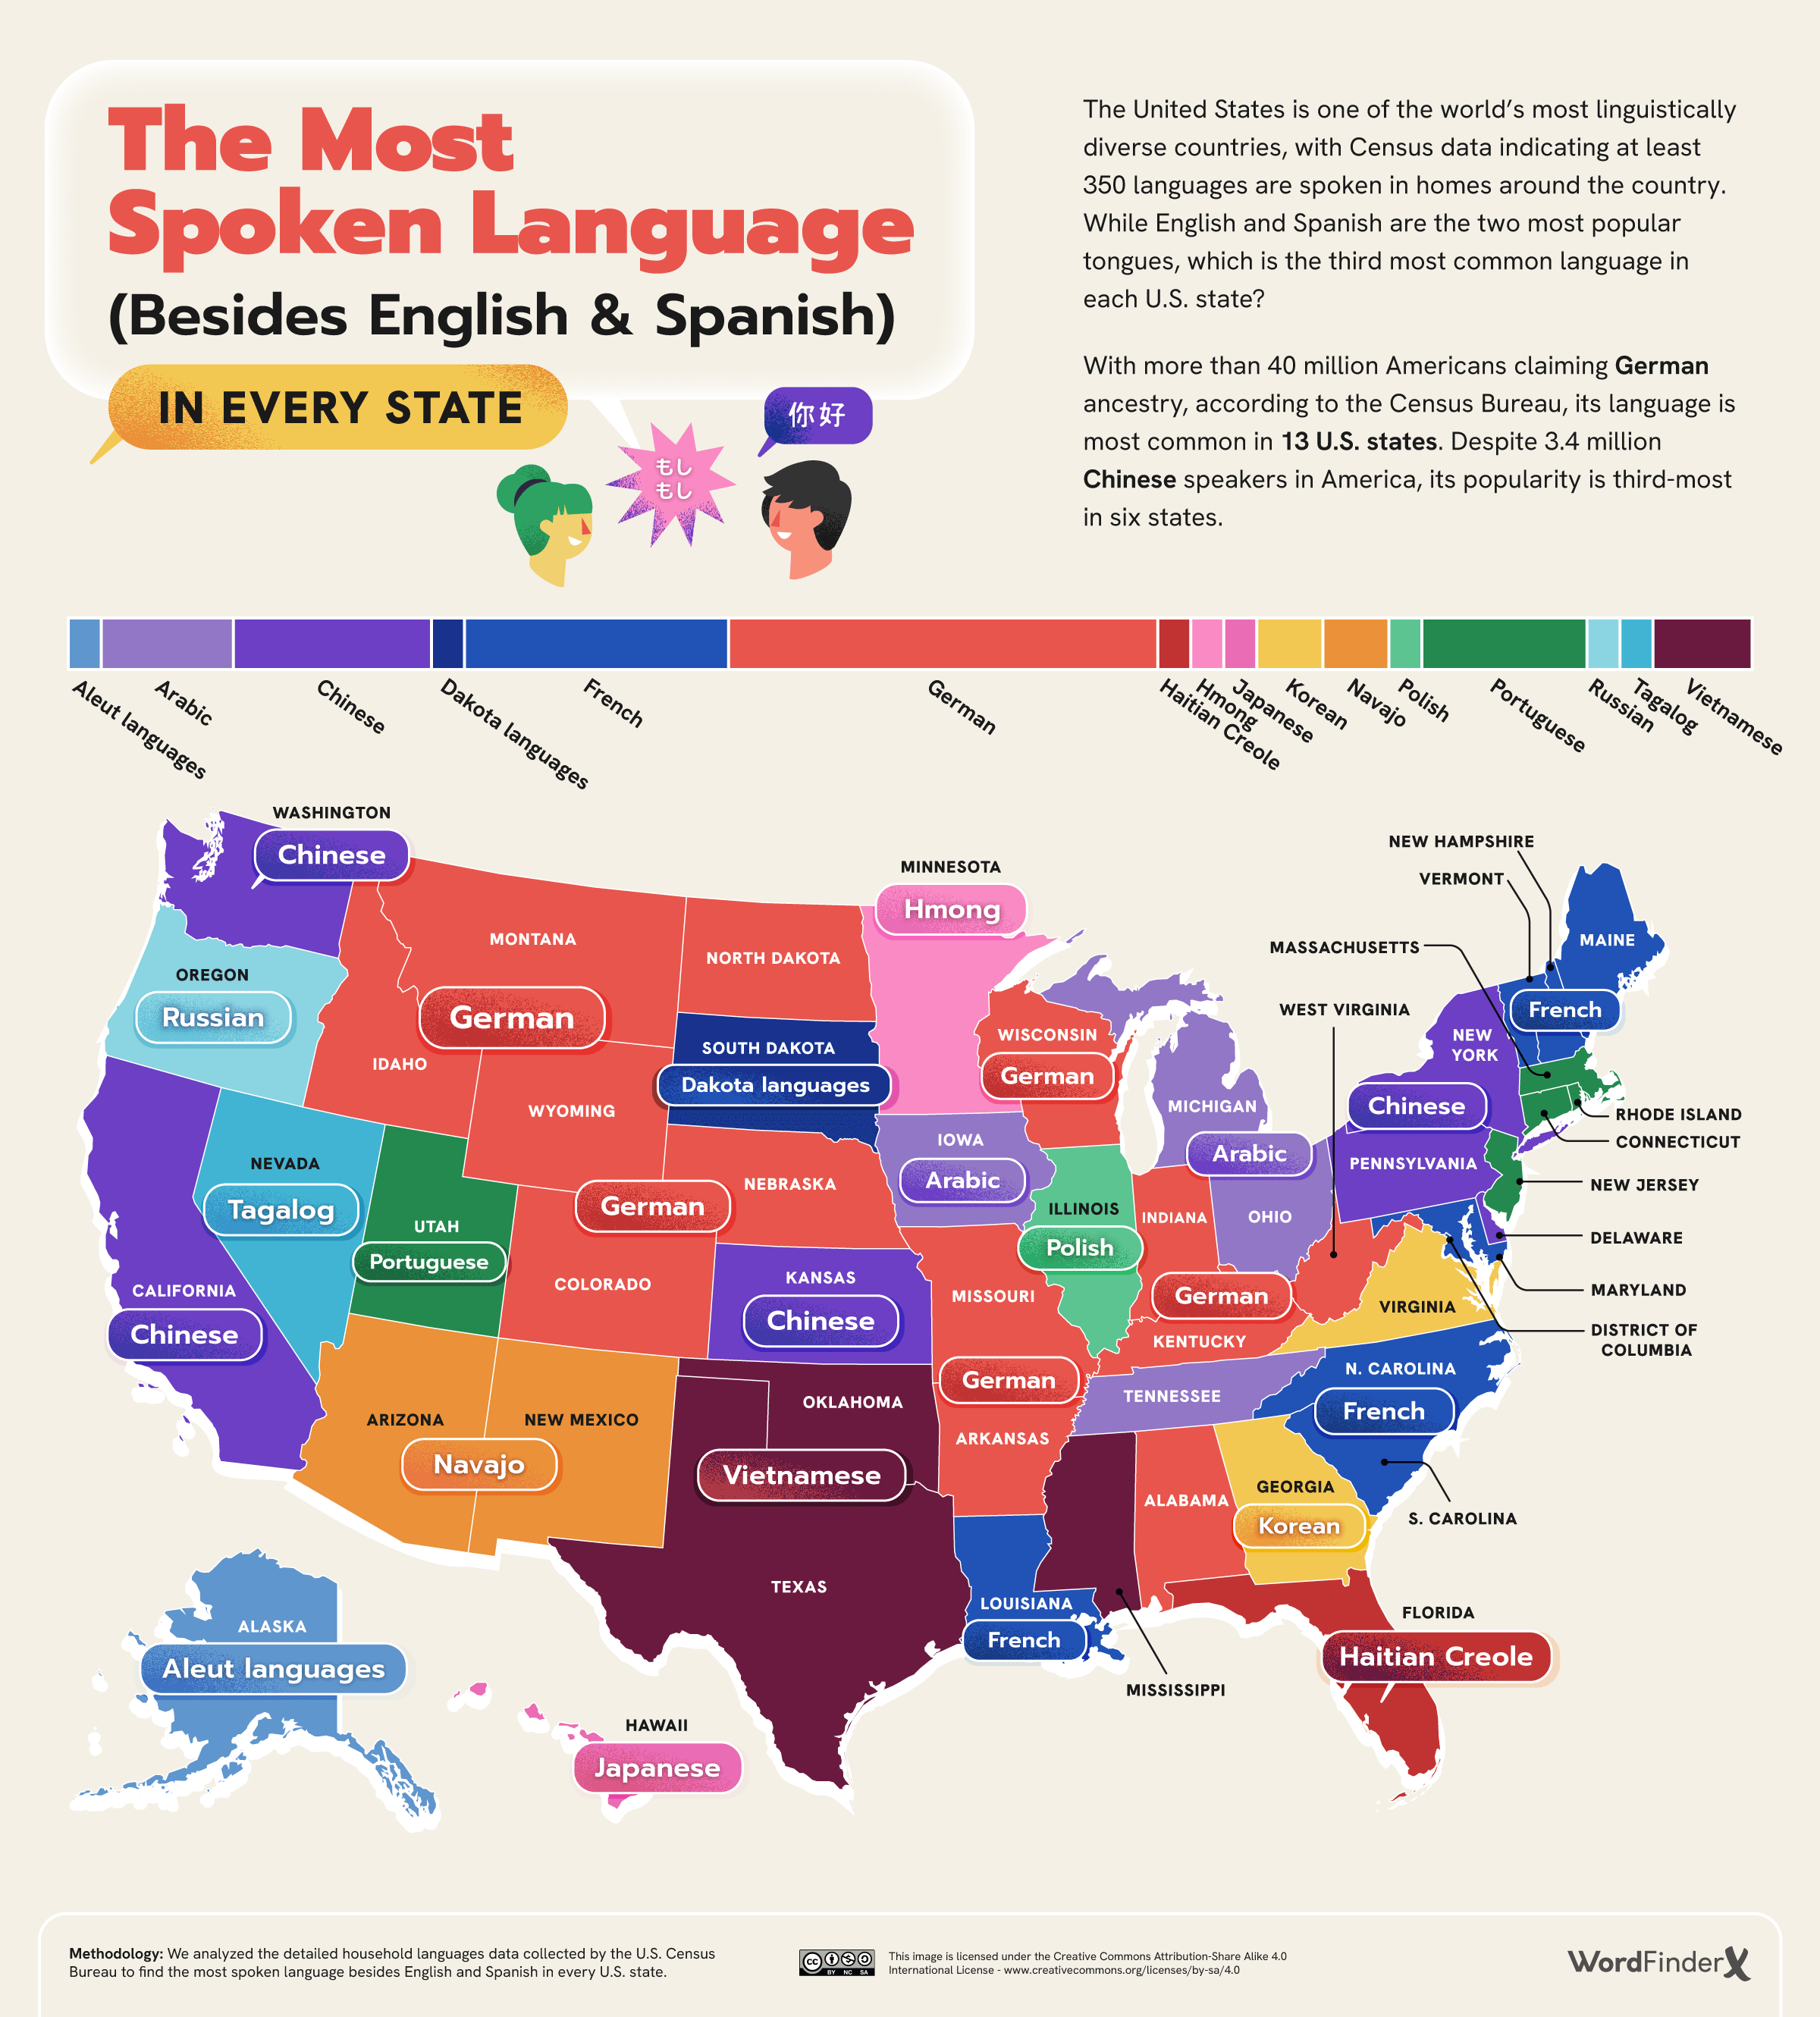
The Most Spoken Language in Every U.S. State (Besides English and Spanish)
Article/Editing:
The Most Spoken Language in Every U.S. State (Besides English and Spanish)
While 78% of Americans speak only English at home, between 350 and 430 languages can be found in the United States.
Spanish is the second most common language, spoken in 62% of non-English-speaking households.
In this graphic, WordFinderX used Census data to uncover the most spoken languages (aside from English and Spanish) in American neighborhoods.
German is the Most Spoken Language in 13 States
During the mid-18th century, German immigrants played a significant role in early American society. They constituted one-third of the population of American colonies, ranking second in numbers only to the English.
As a consequence, German now stands as the third most prevalent language in 13 states, with over 40 million Americans claiming German ancestry.
| State | Most Spoken Language (Besides English and Spanish) |
|---|---|
| Alaska | Aleut languages |
| Alabama | German |
| Arkansas | German |
| Arizona | Navajo |
| California | Chinese |
| Colorado | German |
| Connecticut | Portuguese |
| District of Columbia | French |
| Delaware | Chinese |
| Florida | Haitian Creole |
| Georgia | Korean |
| Hawaii | Japanese |
| Iowa | Arabic |
| Idaho | German |
| Illinois | Polish |
| Indiana | German |
| Kansas | Chinese |
| Kentucky | German |
| Louisiana | French |
| Massachusetts | Portuguese |
| Maryland | French |
| Maine | French |
| Michigan | Arabic |
| Minnesota | Hmong |
| Missouri | German |
| Mississippi | Vietnamese |
| Montana | German |
| North Carolina | French |
| North Dakota | German |
| Nebraska | German |
| New Hampshire | French |
| New Jersey | Portuguese |
| New Mexico | Navajo |
| Nevada | Tagalog |
| New York | Chinese |
| Ohio | Arabic |
| Oklahoma | Vietnamese |
| Oregon | Russian |
| Pennsylvania | Chinese |
| Rhode Island | Portuguese |
| South Carolina | French |
| South Dakota | Dakota languages |
| Tennessee | Arabic |
| Texas | Vietnamese |
| Utah | Portuguese |
| Virginia | Korean |
| Vermont | French |
| Washington | Chinese |
| Wisconsin | German |
| West Virginia | German |
| Wyoming | German |
From military aid to ideological support, France played a pivotal role in the success of the American Revolution. More than two centuries later, approximately 9.4 million people in the U.S. claim French or French-Canadian ancestry.
In the Midwest, French stands as the most spoken language (following English and Spanish) in four major cities.
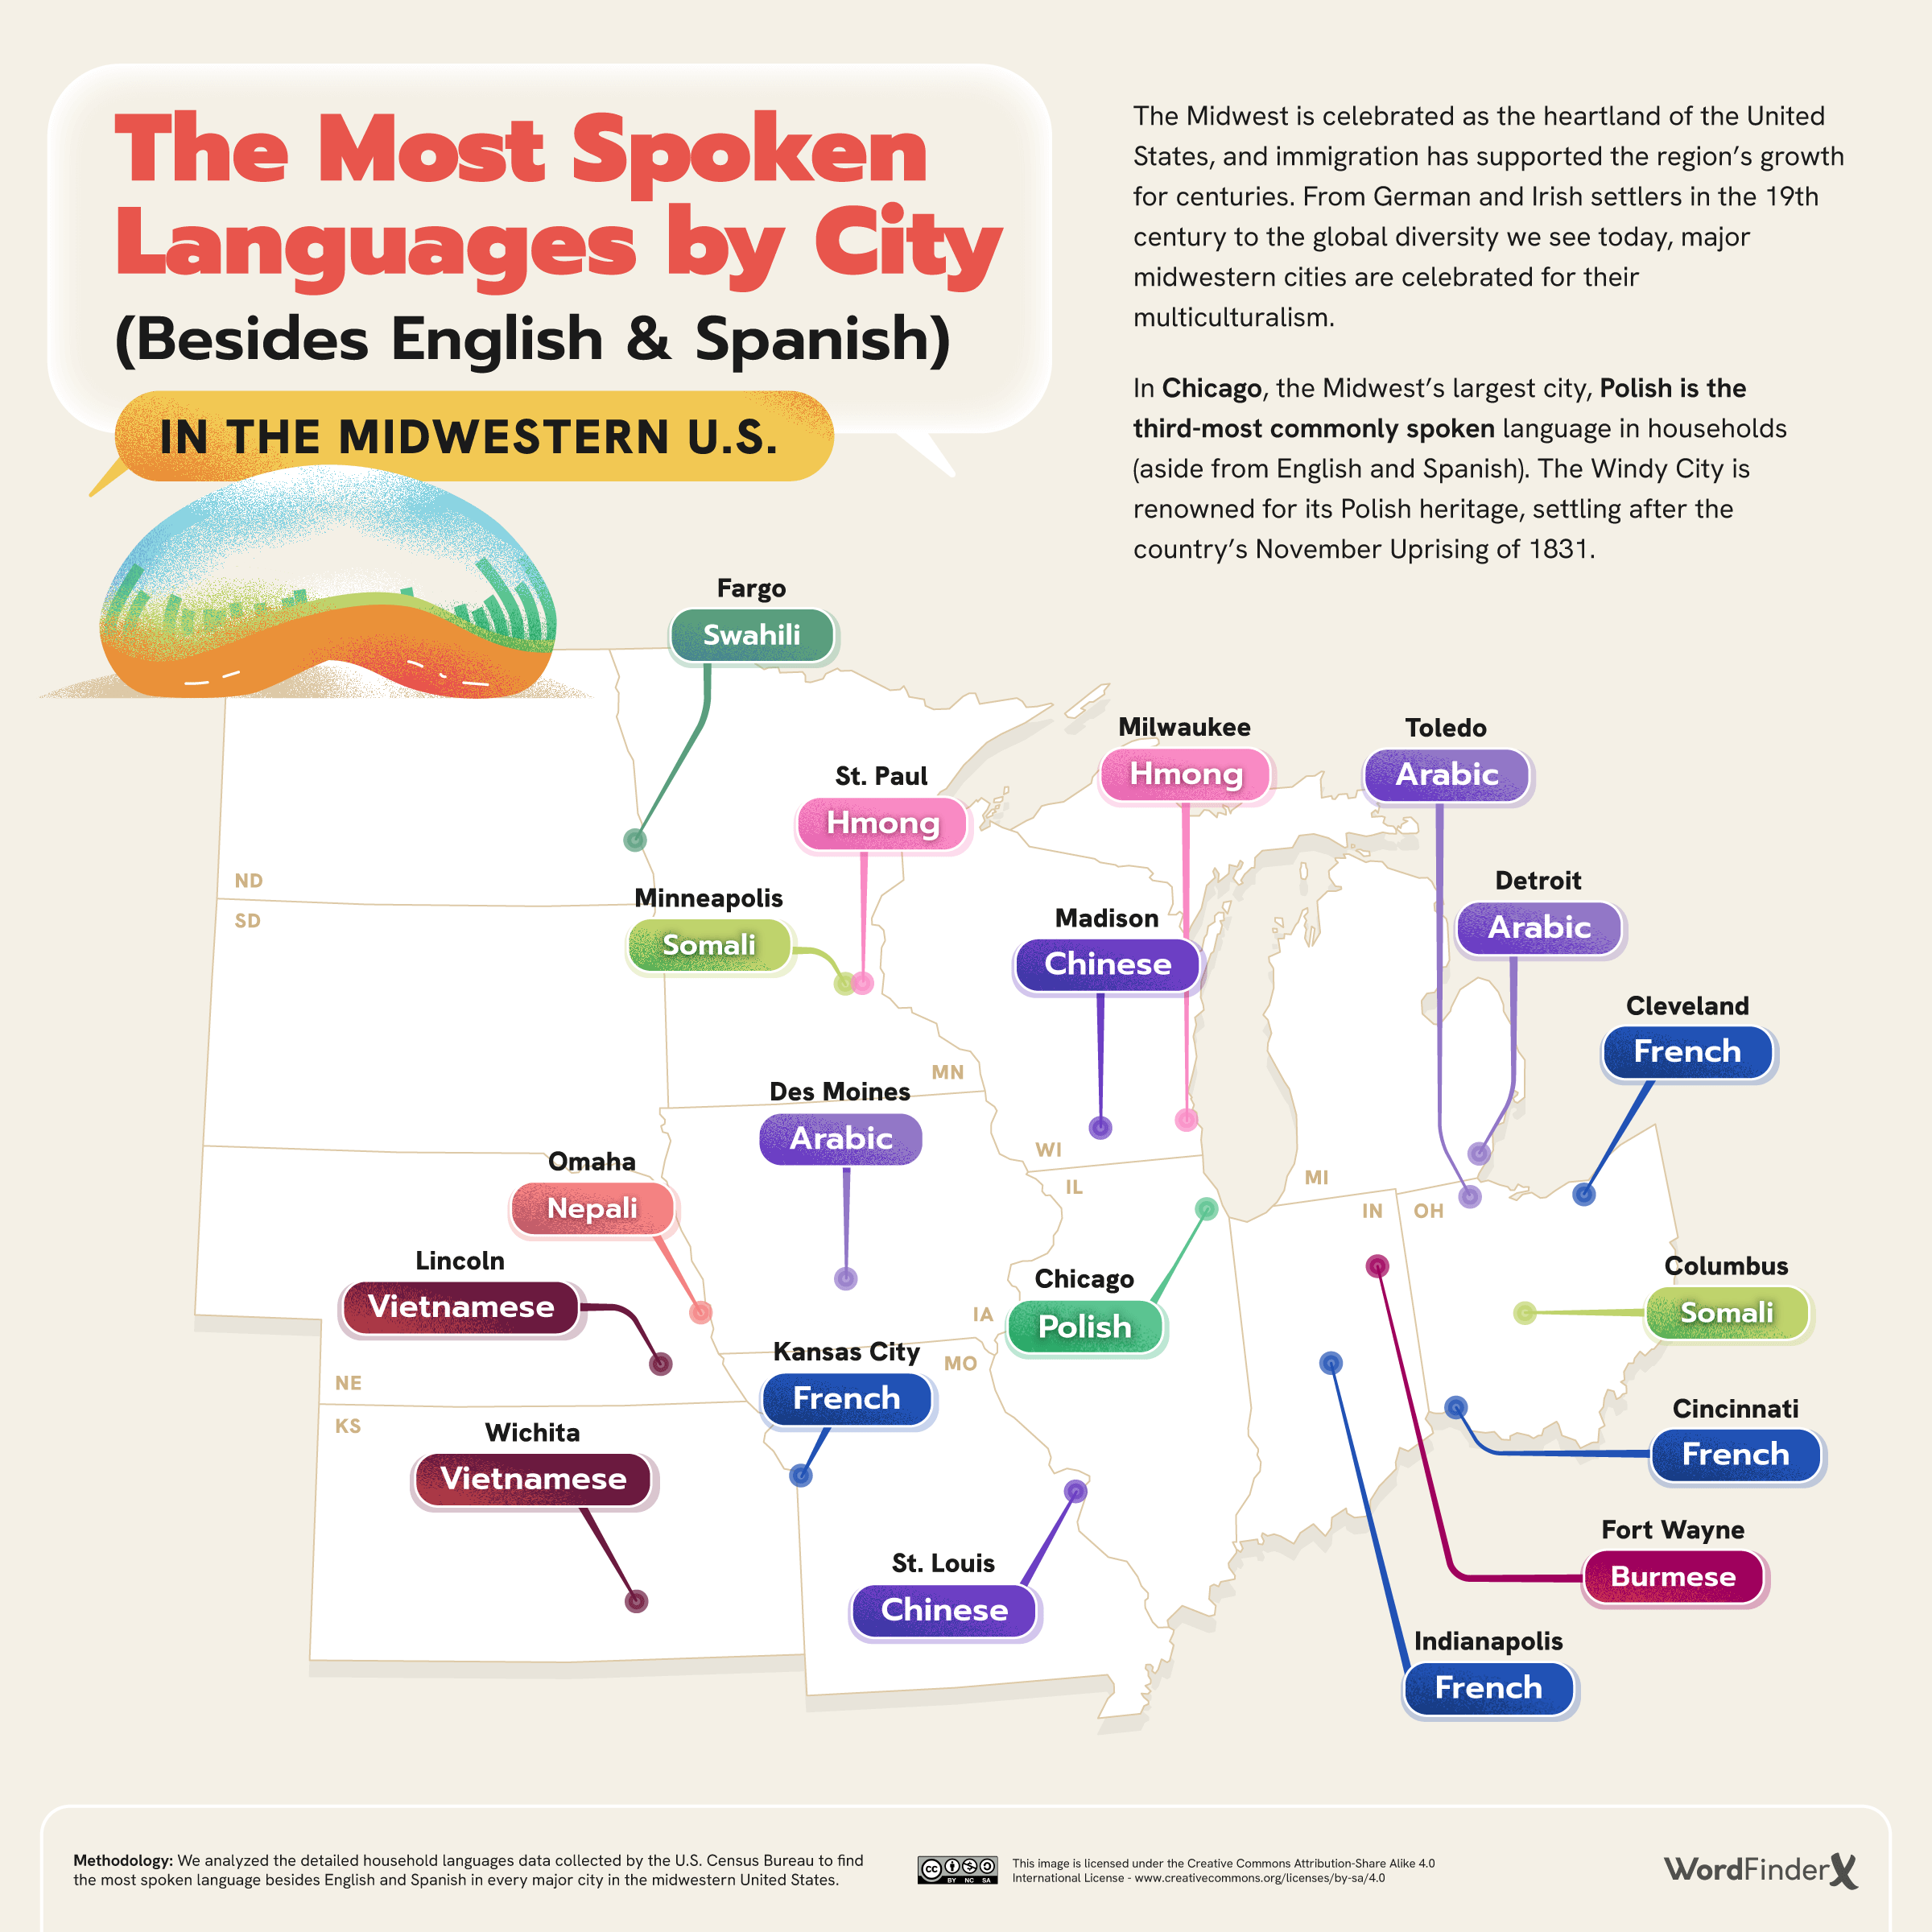
In the Midwest’s largest city, Chicago, Polish is the third-most common spoken language.
Asian Languages in the American West
The American West is home to 45% of all U.S. Asians, making Asian languages the most spoken in many cities, following English and Spanish.
Tagalog is the most spoken language in nine cities, ranging from Anchorage, Alaska, where half of the local Asian community is Filipino, to Las Vegas, Nevada, home to one of the largest Filipino-American communities in the country.
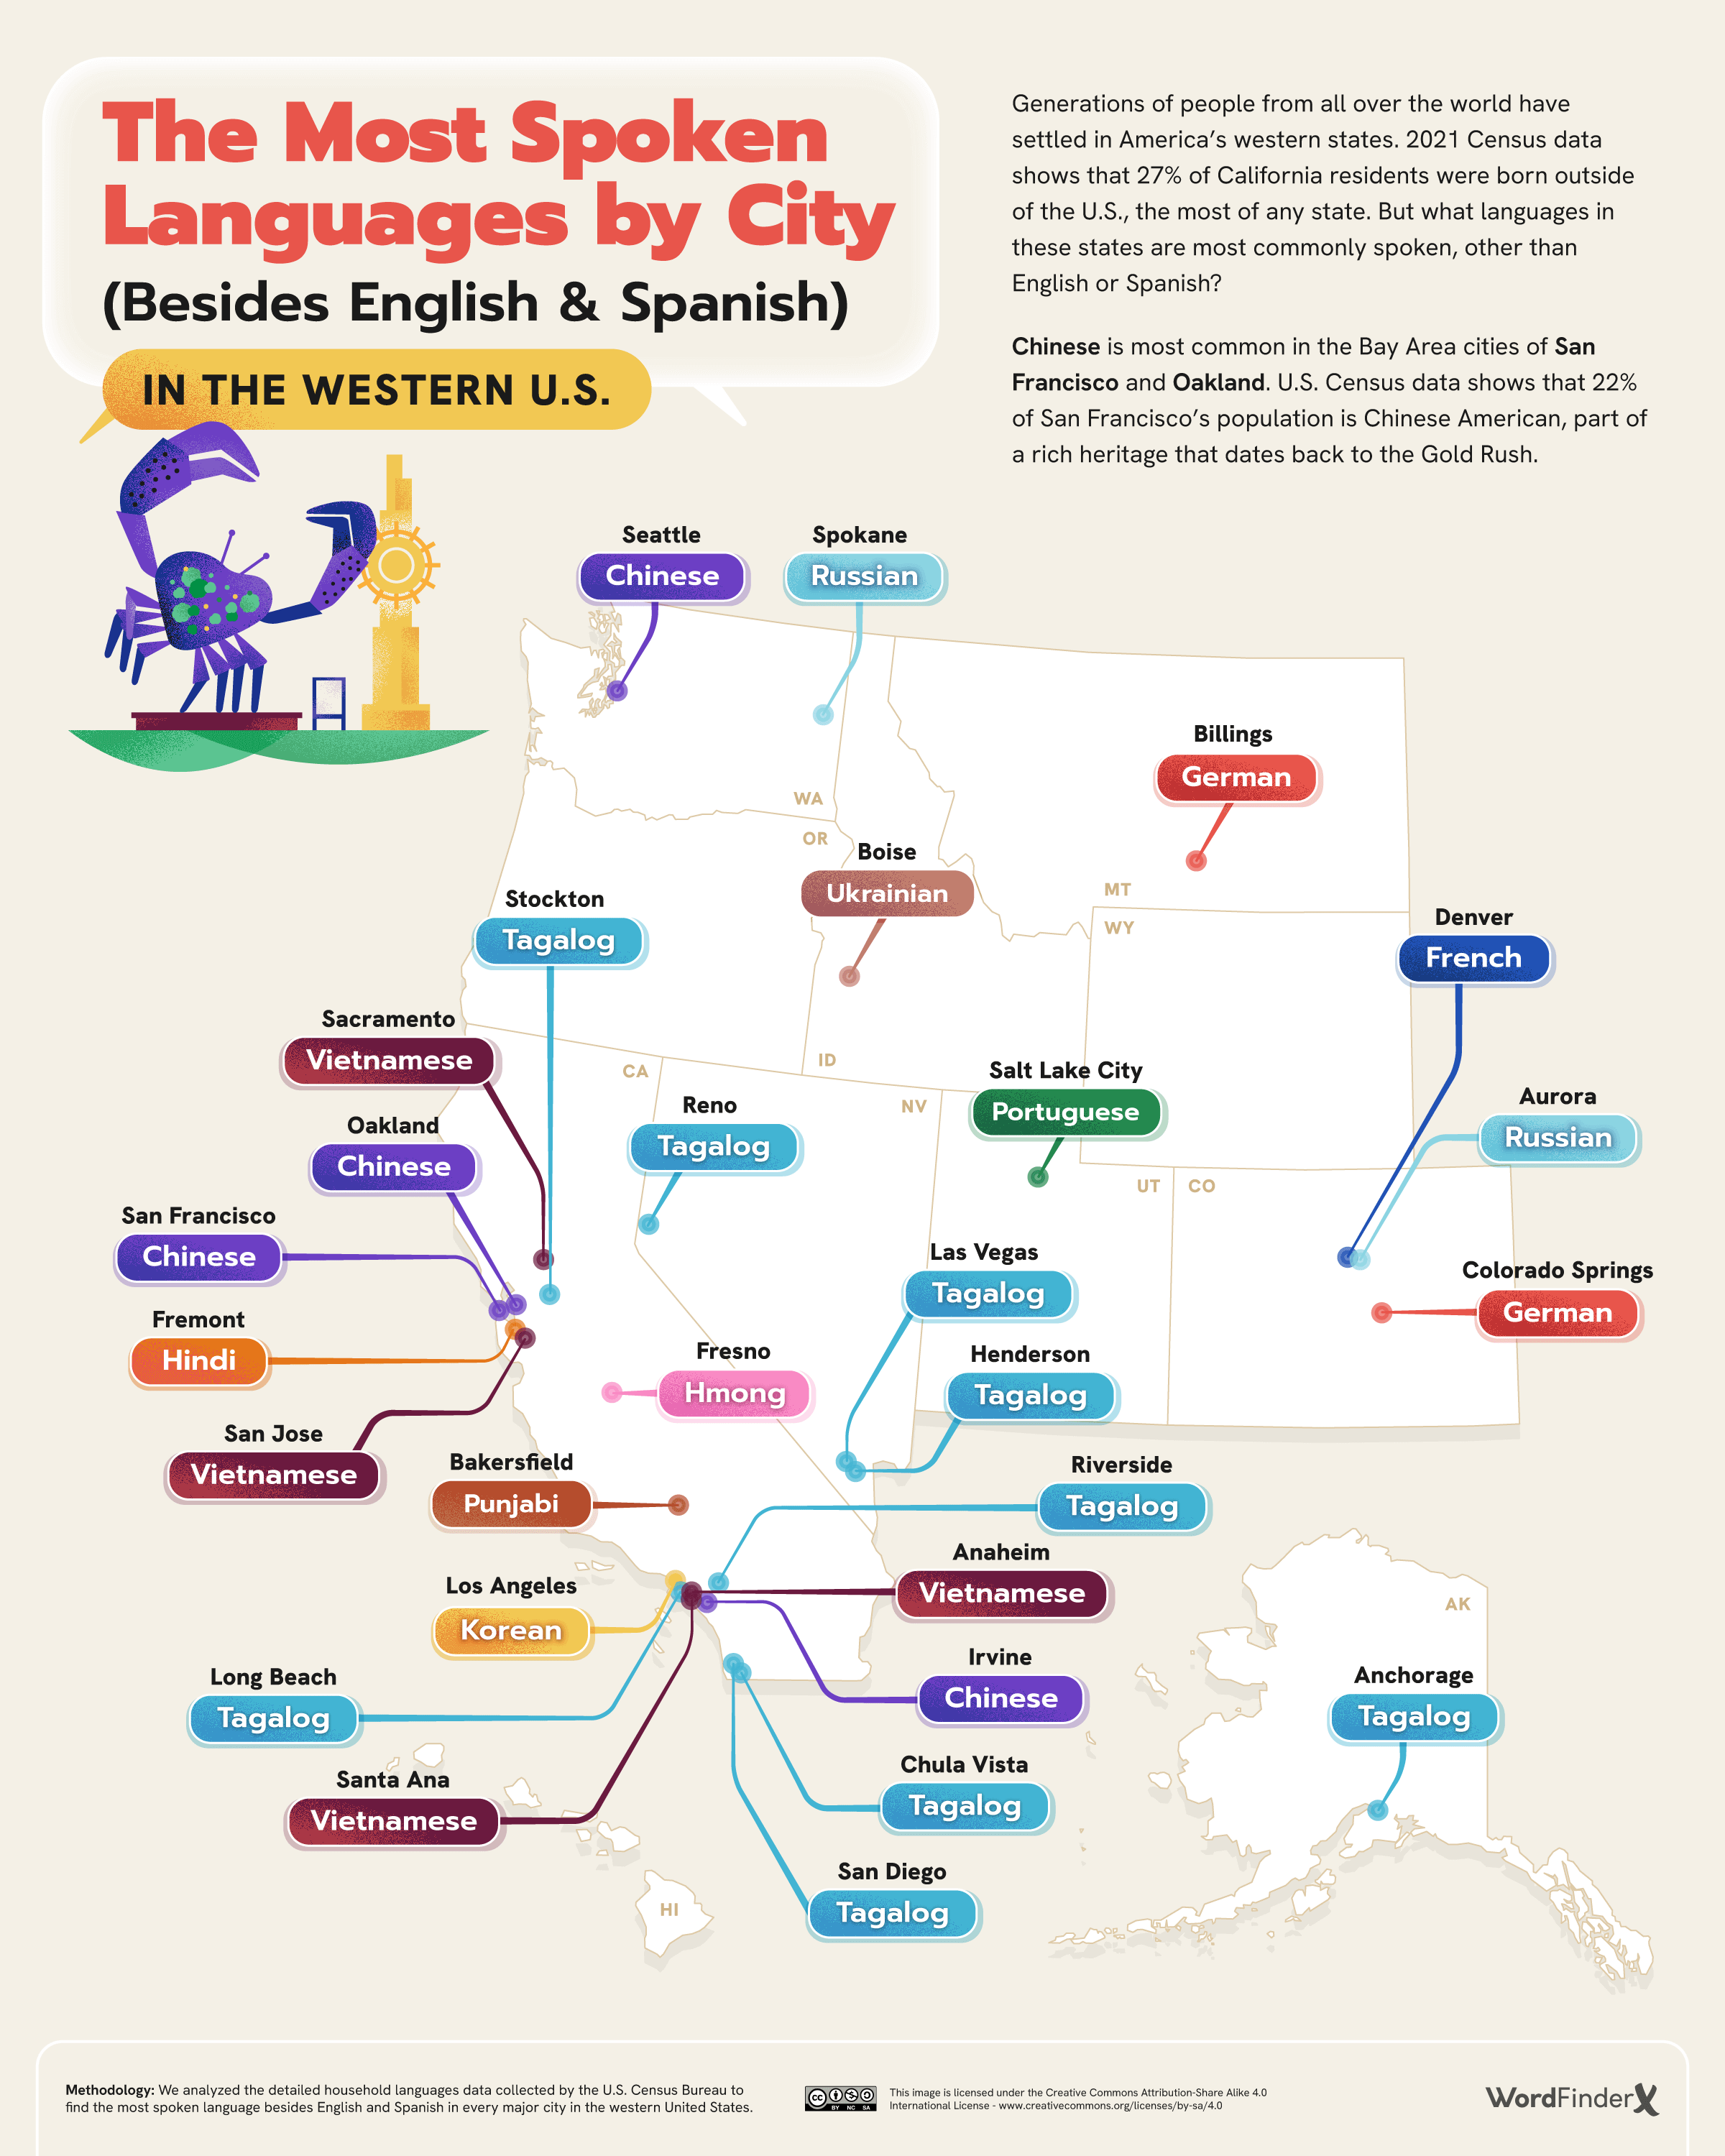
Chinese dominates in California and Washington, while Japanese ranks as the third most common language in Hawaii.
The Most Spoken Languages in New York
In the late 1800s, people worldwide chose to emigrate to the United States, leaving their homes due to crop failure, land and job shortages, rising taxes, and famine. Many also saw the U.S. as a land of economic opportunity.
More than 70% of all immigrants entered through New York City, which came to be known as the “Golden Door.”
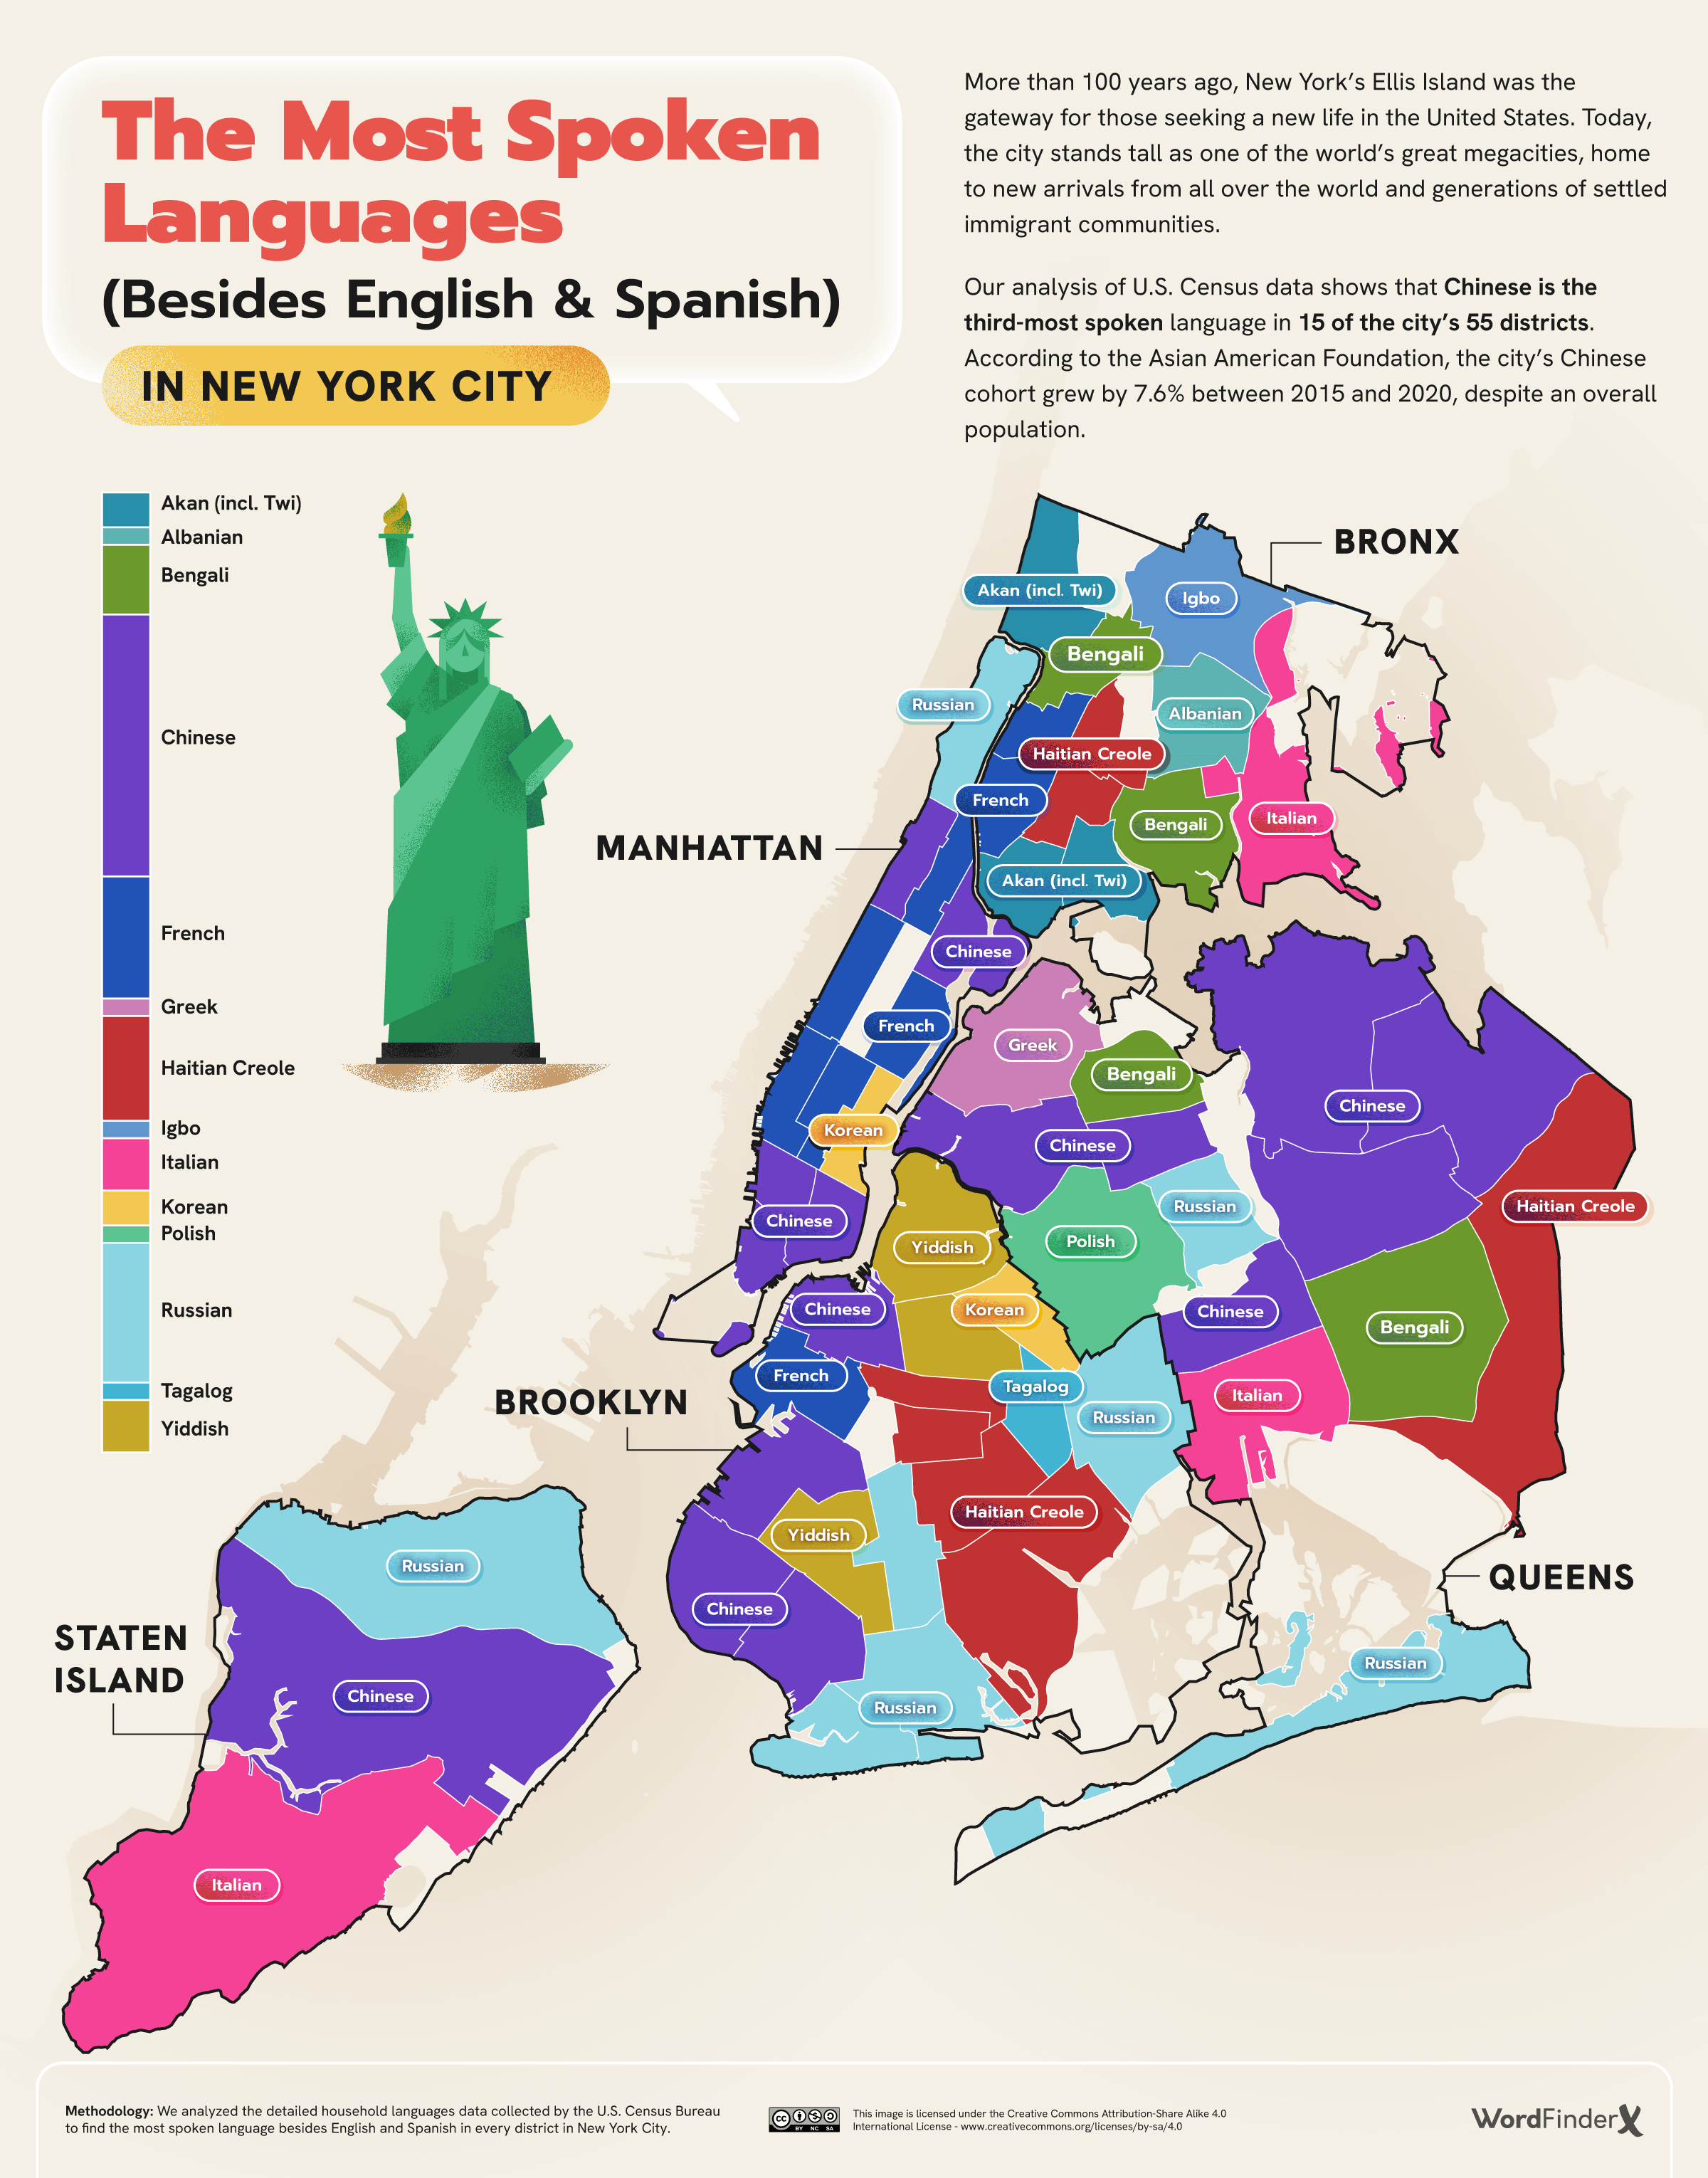
As a result, the city today has an eclectic mix of languages.
While numerous languages across America thrive, some face imminent extinction. These include rare regional dialects, like the Pawpaw French in Minnesota, and indigenous languages.
According to the National Congress of American Indians, all surviving Native American languages are severely endangered, with over 90% of them at risk of extinction by 2050.
Various initiatives, including leveraging technology, have been proposed to ensure the preservation of the diverse cultures and languages in the U.S.

This article was published as a part of Visual Capitalist's Creator Program, which features data-driven visuals from some of our favorite Creators around the world.


Mining
The Biggest Salt Producing Countries in 2023
In this graphic, we break down global salt production in 2023. China is currently the top producer, accounting for almost 20% of output.
The Biggest Salt Producing Countries in 2023
This was originally posted on our Voronoi app. Download the app for free on iOS or Android and discover incredible data-driven charts from a variety of trusted sources.
Humanity has utilized salt for thousands of years, dating back to ancient civilizations. The U.S. alone consumes more than 48 million tonnes of salt per year.
In this graphic, we break down global salt production in 2023, measured in tonnes. These estimates come from the U.S. Geological Survey’s latest commodity report on salt.
Ample Supply
Salt is essential for human life, serving various purposes including food preservation, flavor enhancement, industrial processes, and health maintenance. The good news is that the world’s continental resources of salt are vast, and the salt content in the oceans is nearly unlimited.
China is currently the top producer of salt, with almost 20% of the output, followed by the U.S. (15%) and India (11%).
| Country | Production (tonnes) |
|---|---|
| 🇨🇳 China | 53,000,000 |
| 🇺🇸 United States | 42,000,000 |
| 🇮🇳 India | 30,000,000 |
| 🇩🇪 Germany | 15,000,000 |
| 🇦🇺 Australia | 14,000,000 |
| 🇨🇦 Canada | 12,000,000 |
| 🇨🇱 Chile | 9,200,000 |
| 🇲🇽 Mexico | 9,000,000 |
| 🇹🇷 Turkey | 9,000,000 |
| 🇷🇺 Russia | 7,000,000 |
| 🇧🇷 Brazil | 6,600,000 |
| Rest of world | 67,000,000 |
| Global total | 273,800,000 |
The global salt market was valued at $32.6 billion in 2022.
It’s projected to grow from $34.1 billion in 2023 to $48.6 billion by 2030, with a CAGR of 5.2% during the forecast period. This suggests a surprising amount of growth for what is one of the world’s oldest and most common commodities.
Facts About the U.S. Salt Industry
In the U.S., salt is produced by 25 companies, which operate 63 plants across 16 states.
The states that produce the most salt are Kansas, Louisiana, Michigan, New York, Ohio, Texas, and Utah. Altogether, these states account for 95% of domestic production.
The primary uses of salt in the U.S. are highway de-icing (41%), chemical production (38%), and food processing (10%).

-

 Markets1 week ago
Mapped: The Most Valuable Company in Each Southeast Asian Country
-

 Personal Finance6 days ago
Visualizing the Tax Burden of Every U.S. State
-

 Mining7 days ago
Where the World’s Aluminum is Smelted, by Country
-

 Technology1 week ago
Countries With the Highest Rates of Crypto Ownership
-

 Money1 week ago
Charted: What Frustrates Americans About the Tax System
-

 Economy1 week ago
Mapped: Europe’s GDP Per Capita, by Country
-

 Stocks1 week ago
The Growth of a $1,000 Equity Investment, by Stock Market
-

 Healthcare1 week ago
Life Expectancy by Region (1950-2050F)