United States
Ranked: The 20 Most Popular Neighborhoods for Potential U.S. Homebuyers
Article/Editing:

Most Popular Neighborhoods for Potential U.S. Homebuyers
Location, location, location. This phrase has been a real estate mantra since time immemorial, and rightly so. Finding the right home is impossible without finding the right neighborhood.
Thousands of U.S. homebuyers scout online real estate marketplaces daily, searching for the right home. But these sites also attract window shoppers curious about the country’s nicest neighborhoods and luxurious homes.
HouseFresh has compiled the top 20 most popular neighborhoods by online interest, based on the search history of Zillow users.
Methodology
This study assessed sales listings from the 100 most populous cities in the U.S.
It noted the neighborhood and page views for every house, townhome, apartment, and condo, and the number of days it had been listed on the website to calculate the average page views per day.
Average daily views across each neighborhood were then combined and ranked to reveal the top 20 neighborhoods. Neighborhoods with fewer than 10 listings were excluded from the rankings.
America’s Most Popular Neighborhoods by Search Interest
In the post-pandemic world, surging housing prices have been a critical concern for American homebuyers.
That’s likely why the most popular neighborhood—Northeast Dallas, which is highly sought-after for being in a strong market with lots of options in both size and affordability—can outperform more famous neighborhoods in viewing interest.
Here are how different neighborhoods in the U.S. stacked up:
Other strong cities for both first-time and second-time home buyers performed well. With affordable house values, sunny skies, large recreation spaces, and a dry climate, Phoenix had the strongest interest for a single city with three neighborhoods in the top 10: Camelback East, North Mountain, and Deer Valley.
On the other end of the spectrum were some of the nation’s most valuable real estate markets. Los Angeles’ celebrity hub of Hollywood Hills had the highest average price per listing at $2.3 million, and was the second-most popular neighborhood in average daily views. Listings in New York’s affluent Upper East Side also drew in crowds and was the 5th most viewed neighborhood.
The Zillow data has revealed that a neighborhood’s popularity varies depending on the viewer. While some look for affordable neighborhoods with big houses and parks, others have their eyes on the glamor of a vibrant city, irrespective of the cost.

This article was published as a part of Visual Capitalist's Creator Program, which features data-driven visuals from some of our favorite Creators around the world.


United States
Ranked: The Top 6 Economies by Share of Global GDP (1980-2024)
Gain a unique perspective on the world’s economic order from this graphic showing % share of global GDP over time.

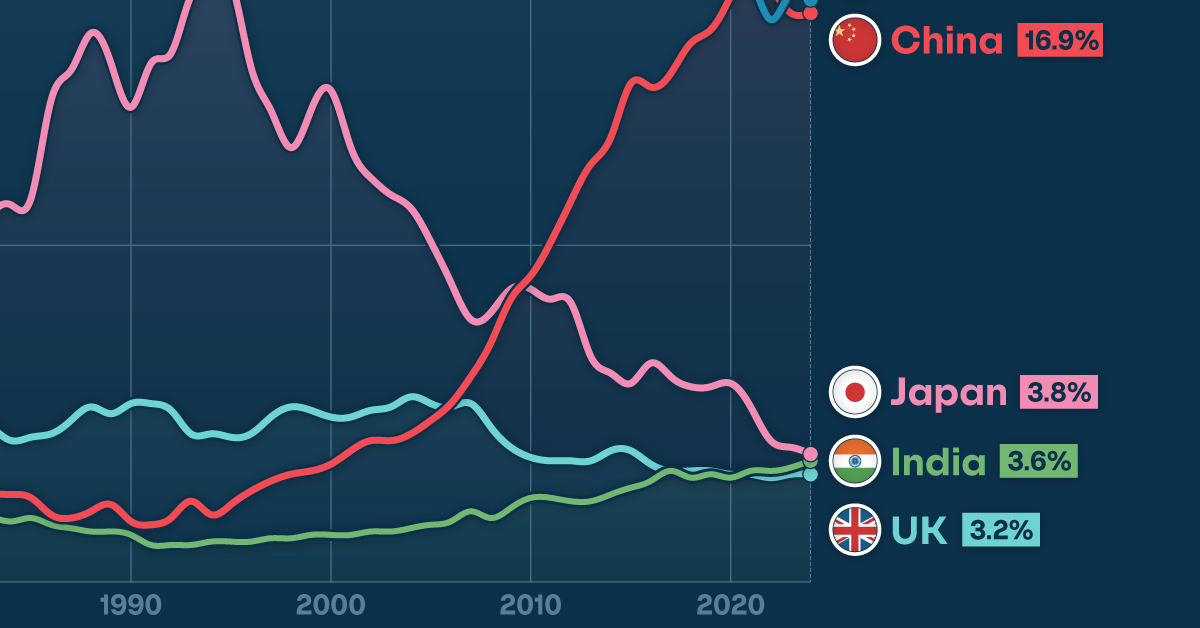
Top 6 Economies by Share of Global GDP (1980-2024)
This was originally posted on our Voronoi app. Download the app for free on iOS or Android and discover incredible data-driven charts from a variety of trusted sources.
Over time, the distribution of global GDP among the world’s largest economies has shifted dynamically, reflecting changes in economic policies, technological advancements, and demographic trends.
To see how this has played out in recent decades, we visualized the world’s top six economies by their share of global GDP from 1980 to 2024.
All figures were sourced from the IMF’s World Economic Outlook (April 2024 edition) and are based on using current prices.
Data and Highlights
The data we used to create this graphic can be found in the table below.
| Share of Global GDP (%) | U.S. | EU | China | Japan | UK | India |
|---|---|---|---|---|---|---|
| 1980 | 25.4% | 28.6% | 2.7% | 10.1% | 5.4% | 1.7% |
| 1981 | 27.8% | 24.7% | 2.5% | 10.8% | 5.1% | 1.7% |
| 1982 | 29.6% | 24.4% | 2.5% | 10.2% | 4.9% | 1.8% |
| 1983 | 31.3% | 23.2% | 2.6% | 10.9% | 4.6% | 1.9% |
| 1984 | 33.6% | 21.6% | 2.6% | 11.2% | 4.2% | 1.8% |
| 1985 | 34.6% | 21.3% | 2.5% | 11.4% | 4.3% | 1.9% |
| 1986 | 31.0% | 24.7% | 2.0% | 14.3% | 4.4% | 1.7% |
| 1987 | 28.5% | 26.3% | 1.9% | 15.2% | 4.8% | 1.6% |
| 1988 | 27.3% | 25.9% | 2.1% | 16.3% | 5.2% | 1.5% |
| 1989 | 28.0% | 25.0% | 2.3% | 15.4% | 5.0% | 1.5% |
| 1990 | 26.3% | 27.4% | 1.8% | 14.1% | 5.3% | 1.4% |
| 1991 | 26.0% | 28.0% | 1.7% | 15.4% | 5.3% | 1.1% |
| 1992 | 25.7% | 28.8% | 1.9% | 15.7% | 5.1% | 1.1% |
| 1993 | 26.3% | 25.6% | 2.4% | 17.4% | 4.4% | 1.1% |
| 1994 | 26.0% | 25.3% | 2.0% | 17.8% | 4.4% | 1.2% |
| 1995 | 24.5% | 26.5% | 2.3% | 17.8% | 4.3% | 1.2% |
| 1996 | 25.1% | 26.2% | 2.7% | 15.3% | 4.4% | 1.2% |
| 1997 | 26.8% | 24.1% | 3.0% | 14.0% | 4.9% | 1.3% |
| 1998 | 28.4% | 25.0% | 3.2% | 12.9% | 5.2% | 1.3% |
| 1999 | 29.2% | 24.0% | 3.3% | 14.0% | 5.1% | 1.4% |
| 2000 | 30.1% | 21.3% | 3.5% | 14.6% | 4.9% | 1.4% |
| 2001 | 31.3% | 21.8% | 3.9% | 12.9% | 4.9% | 1.4% |
| 2002 | 31.3% | 23.1% | 4.2% | 12.0% | 5.1% | 1.5% |
| 2003 | 29.2% | 25.3% | 4.2% | 11.5% | 5.2% | 1.5% |
| 2004 | 27.7% | 25.8% | 4.4% | 11.1% | 5.5% | 1.6% |
| 2005 | 27.2% | 24.9% | 4.8% | 10.1% | 5.3% | 1.7% |
| 2006 | 26.7% | 24.5% | 5.3% | 8.9% | 5.2% | 1.8% |
| 2007 | 24.7% | 25.2% | 6.1% | 7.8% | 5.3% | 2.1% |
| 2008 | 23.0% | 25.4% | 7.1% | 8.0% | 4.6% | 1.9% |
| 2009 | 23.8% | 24.3% | 8.4% | 8.7% | 4.0% | 2.2% |
| 2010 | 22.6% | 21.9% | 9.1% | 8.7% | 3.7% | 2.5% |
| 2011 | 21.1% | 21.3% | 10.1% | 8.4% | 3.6% | 2.5% |
| 2012 | 21.6% | 19.5% | 11.3% | 8.3% | 3.6% | 2.4% |
| 2013 | 21.8% | 19.7% | 12.4% | 6.7% | 3.6% | 2.4% |
| 2014 | 22.1% | 19.7% | 13.2% | 6.2% | 3.9% | 2.6% |
| 2015 | 24.4% | 18.0% | 14.8% | 5.9% | 3.9% | 2.8% |
| 2016 | 24.6% | 18.2% | 14.7% | 6.5% | 3.5% | 3.0% |
| 2017 | 24.1% | 18.2% | 15.1% | 6.1% | 3.3% | 3.3% |
| 2018 | 24.0% | 18.5% | 16.0% | 5.8% | 3.3% | 3.1% |
| 2019 | 24.6% | 17.9% | 16.4% | 5.8% | 3.3% | 3.2% |
| 2020 | 25.0% | 18.0% | 17.4% | 5.9% | 3.2% | 3.1% |
| 2021 | 24.3% | 17.9% | 18.3% | 5.2% | 3.2% | 3.3% |
| 2022 | 25.6% | 16.7% | 17.7% | 4.2% | 3.1% | 3.3% |
| 2023 | 26.1% | 17.5% | 16.9% | 4.0% | 3.2% | 3.4% |
| 2024E | 26.3% | 17.3% | 16.9% | 3.8% | 3.2% | 3.6% |
U.S. Resilience
Starting with the U.S., we can see that America’s share of global GDP has fluctuated quite significantly over time.
After bottoming out at 21.1% in 2011, the U.S. economy grew its relative size by several percentage points, and is estimated by the IMF to make up 26.3% of global GDP in 2024.
This chart also suggests that the U.S. has managed a stronger recovery from the COVID-19 pandemic, evidenced by its rising share of global GDP since 2020. China, the EU, and Japan have seen relative declines over the same period.
China’s Incredible Rise
This chart also provides perspective on China’s period of rapid economic growth, which began in the early 2000s.
It’s interesting to note that China joined the World Trade Organization (WTO) in 2001, which facilitated China’s integration into the global economy.
Japan Falls From the #2 Spot
Japan was once the second largest country economy after the U.S., accounting for 17.8% of the global economy in 1994 and 1995. Since then, economic stagnation and an aging population have resulted in a relative decline of the country’s economic might.
See More Global Economic Insights From Visual Capitalist
If you enjoyed this post, be sure to check out Ranked: The Top Economies in the World (1980-2075), which shows how China and India could eventually surpass the U.S. as the world’s biggest economies.

-

 Markets1 week ago
Mapped: The Most Valuable Company in Each Southeast Asian Country
-

 Personal Finance7 days ago
Visualizing the Tax Burden of Every U.S. State
-

 Mining1 week ago
Where the World’s Aluminum is Smelted, by Country
-

 Technology1 week ago
Countries With the Highest Rates of Crypto Ownership
-

 Money1 week ago
Charted: What Frustrates Americans About the Tax System
-

 Economy1 week ago
Mapped: Europe’s GDP Per Capita, by Country
-

 Stocks1 week ago
The Growth of a $1,000 Equity Investment, by Stock Market
-

 Healthcare1 week ago
Life Expectancy by Region (1950-2050F)