Wealth
Where Do the World’s Wealthiest People Live?
![]() See this visualization first on the Voronoi app.
See this visualization first on the Voronoi app.
Where Do the Wealthy Live?
This was originally posted on our Voronoi app. Download the app for free on iOS or Android and discover incredible data-driven charts from a variety of trusted sources.
In 2022, global household wealth stood at $454 trillion, of which half was held by millionaires.
But where do the wealthiest people of the world live?
From UBS and Credit Suisse’s comprehensive Global Wealth Report 2023, we visualize the world’s millionaire population by country. Their databook details the sources they used, including household balance sheet data from the World Bank, the World Income Inequality Database, surveys, tax data, and Forbes’ findings.
UBS defines millionaires as individuals whose total wealth (including financial and non-financial assets, minus household debt) is at or above $1 million, using “smoothed exchange rates.” These are 2021 average currency exchange rates with the U.S. dollar, adjusted for inflation differences between the U.S. and concerned country, but not adjusted for U.S. inflation between 2021 and 2022.
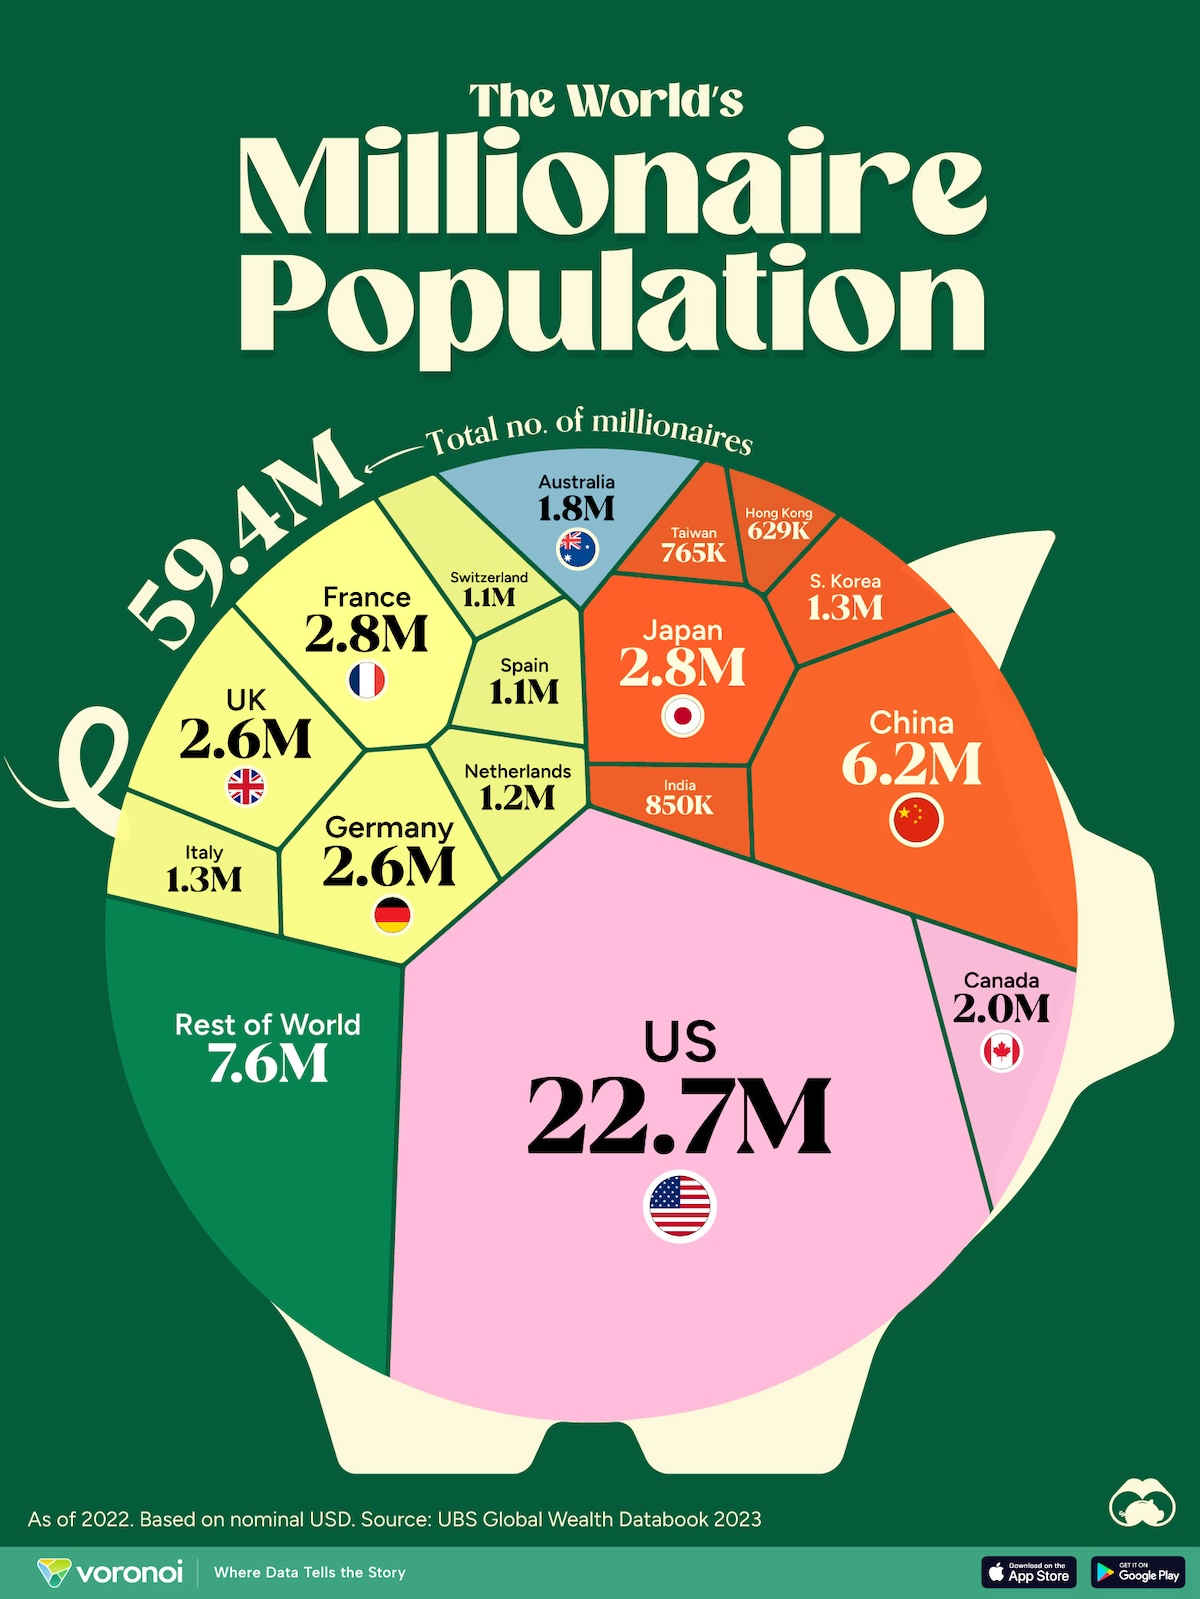
With information current up to 2022, the world has almost 60M millionaires, of which 42% reside in North America.
| Rank | Region | Millionaires |
|---|---|---|
| 1 | North America | 24.7M |
| 2 | Europe | 16.3M |
| 3 | Asia-Pacific | 9.8M |
| 4 | China | 6.2M |
| 5 | Latin America | 1.2M |
| 6 | India | 0.85M |
| 7 | Africa | 0.36M |
| World | 59.4M |
Note: UBS separates China and India from their Asia-Pacific region for better clarity
Within that statistic is an obvious heavyweight, and we look through the per-country millionaire population in the next section.
Ranked: Countries By Number of Millionaires
The U.S. is home to nearly 23M millionaires, 40% of the total millionaire population in the world. Six American cities feature in the world’s wealthiest cities, led by New York City, home to 340,000 millionaires.
As it happens, this quantity is actually lower than the 24M American millionaires in 2021, as average wealth in the category fell due to a decline in the value of financial assets.
| Rank | Country | Millionaires | Continent |
|---|---|---|---|
| 1 | 🇺🇸 U.S. | 22.7M | North America |
| 2 | 🇨🇳 China | 6.2M | Asia |
| 3 | 🇫🇷 France | 2.8M | Europe |
| 4 | 🇯🇵 Japan | 2.8M | Asia |
| 5 | 🇩🇪 Germany | 2.6M | Europe |
| 6 | 🇬🇧 UK | 2.6M | Europe |
| 7 | 🇨🇦 Canada | 2.0M | North America |
| 8 | 🇦🇺 Australia | 1.8M | Oceania |
| 9 | 🇮🇹 Italy | 1.3M | Europe |
| 10 | 🇰🇷 Korea | 1.3M | Asia |
| 11 | 🇳🇱 Netherlands | 1.2M | Europe |
| 12 | 🇪🇸 Spain | 1.1M | Europe |
| 13 | 🇨🇭 Switzerland | 1.1M | Europe |
| 14 | 🇮🇳 India | 850K | Asia |
| 15 | 🇹🇼 Taiwan | 765K | Asia |
| 16 | 🇭🇰 Hong Kong | 629K | Asia |
| N/A | 🌍 ROW | 7.6M | N/A |
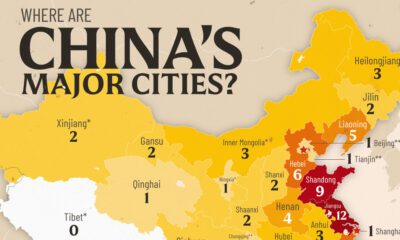
The world’s second-largest economy, China, is also home to the second-highest number of wealthy individuals, at 6M, about 10% of the total millionaire population. The number of Chinese residents with more than $1 million has grown rapidly since 2012, especially in economic hotspots like Hangzhou and Shenzhen.
At third and fourth, France and Japan essentially have the same number of millionaires (2.8M) as do Germany and the UK who round out the top six with 2.6M millionaires each.
The top 10 countries with the most millionaires are the 10 largest economies in the world, with the exception of India (ranked 14th) and Brazil, which is outside the top millionaire residents ranks, but grew its millionaire population by 122,000 between 2021 and 2022.
Within this data however, UBS differentiates between the various types of millionaires.
| Wealth Distribution | Number of Millionaires | % of Millionaires in 2022 |
|---|---|---|
| $1–5 Million | 51.67M | 87.0% |
| $5–10 Million | 5.10M | 8.6% |
| > $10 Million | 2.73M | 4.6% |
Note: Percentages may not sum to 100 due to rounding.
Of the last category of individuals with more than $10 million, 2.5M have assets in the $10–50 million range, leaving 243,000 ultra-high-net-worth individuals with a net worth above $50 million. This ultra-high-net-worth category has grown four times since 2008.
UBS believes that by 2027, the world will have over 85M millionaires. This is 26M more than today, and 71M more from the year 2000.


Wealth
Visualizing the Tax Burden of Every U.S. State
Tax burden measures the percent of an individual’s income that is paid towards taxes. See where it’s the highest by state in this graphic.


Visualizing the Tax Burden of Every U.S. State
This was originally posted on our Voronoi app. Download the app for free on iOS or Android and discover incredible data-driven charts from a variety of trusted sources.
This map graphic visualizes the total tax burden in each U.S. state as of March 2024, based on figures compiled by WalletHub.
It’s important to understand that under this methodology, the tax burden measures the percent of an average person’s income that is paid towards state and local taxes. It considers property taxes, income taxes, and sales & excise tax.
Data and Methodology
The figures we used to create this graphic are listed in the table below.
| State | Total Tax Burden |
|---|---|
| New York | 12.0% |
| Hawaii | 11.8% |
| Vermont | 11.1% |
| Maine | 10.7% |
| California | 10.4% |
| Connecticut | 10.1% |
| Minnesota | 10.0% |
| Illinois | 9.7% |
| New Jersey | 9.5% |
| Rhode Island | 9.4% |
| Utah | 9.4% |
| Kansas | 9.3% |
| Maryland | 9.3% |
| Iowa | 9.2% |
| Nebraska | 9.2% |
| Ohio | 8.9% |
| Indiana | 8.9% |
| Arkansas | 8.8% |
| Mississippi | 8.8% |
| Massachusetts | 8.6% |
| Virginia | 8.5% |
| West Virginia | 8.5% |
| Oregon | 8.4% |
| Colorado | 8.4% |
| Pennsylvania | 8.4% |
| Wisconsin | 8.3% |
| Louisiana | 8.3% |
| Kentucky | 8.3% |
| Washington | 8.0% |
| New Mexico | 8.0% |
| Michigan | 8.0% |
| North Carolina | 7.9% |
| Idaho | 7.9% |
| Arizona | 7.8% |
| Missouri | 7.8% |
| Georgia | 7.7% |
| Texas | 7.6% |
| Alabama | 7.5% |
| Montana | 7.5% |
| South Carolina | 7.5% |
| Nevada | 7.4% |
| Oklahoma | 7.0% |
| North Dakota | 6.8% |
| South Dakota | 6.4% |
| Delaware | 6.4% |
| Tennessee | 6.1% |
| Florida | 6.1% |
| Wyoming | 5.7% |
| New Hampshire | 5.6% |
| Alaska | 4.9% |
From this data we can see that New York has the highest total tax burden. Residents in this state will pay, on average, 12% of their income to state and local governments.
Breaking this down into its three components, the average New Yorker pays 4.6% of their income on income taxes, 4.4% on property taxes, and 3% in sales & excise taxes.
At the other end of the spectrum, Alaska has the lowest tax burden of any state, equaling 4.9% of income. This is partly due to the fact that Alaskans do not pay state income tax.
Hate Paying Taxes?
In addition to Alaska, there are several other U.S. states that don’t charge income taxes. These are: Florida, Nevada, South Dakota, Tennessee, Texas, Washington, and Wyoming.
It’s also worth noting that New Hampshire does not have a regular income tax, but does charge a flat 4% on interest and dividend income according to the Tax Foundation.
Learn More About Taxation From Visual Capitalist
If you enjoyed this post, be sure to check out this graphic which ranks the countries with the lowest corporate tax rates, from 1980 to today.
-

 Energy1 week ago
Ranked: The World’s Largest Lithium Producers in 2023
-

 Public Opinion2 weeks ago
Charted: How Democrats and Republicans View Government Agencies
-

 Globalization2 weeks ago
Mapped: The Top Exports in Asian Countries
-

 Finance2 weeks ago
Ranked: The World’s 50 Largest Private Equity Firms
-

 United States2 weeks ago
Mapped: The 10 U.S. States With the Lowest Real GDP Growth
-

 China2 weeks ago
Comparing New and Current U.S. Tariffs on Chinese Imports
-

 Politics2 weeks ago
Which Countries Have the Most Economic Influence in Southeast Asia?
-

 population2 weeks ago
The Top 25 Nationalities of U.S. Immigrants