Money
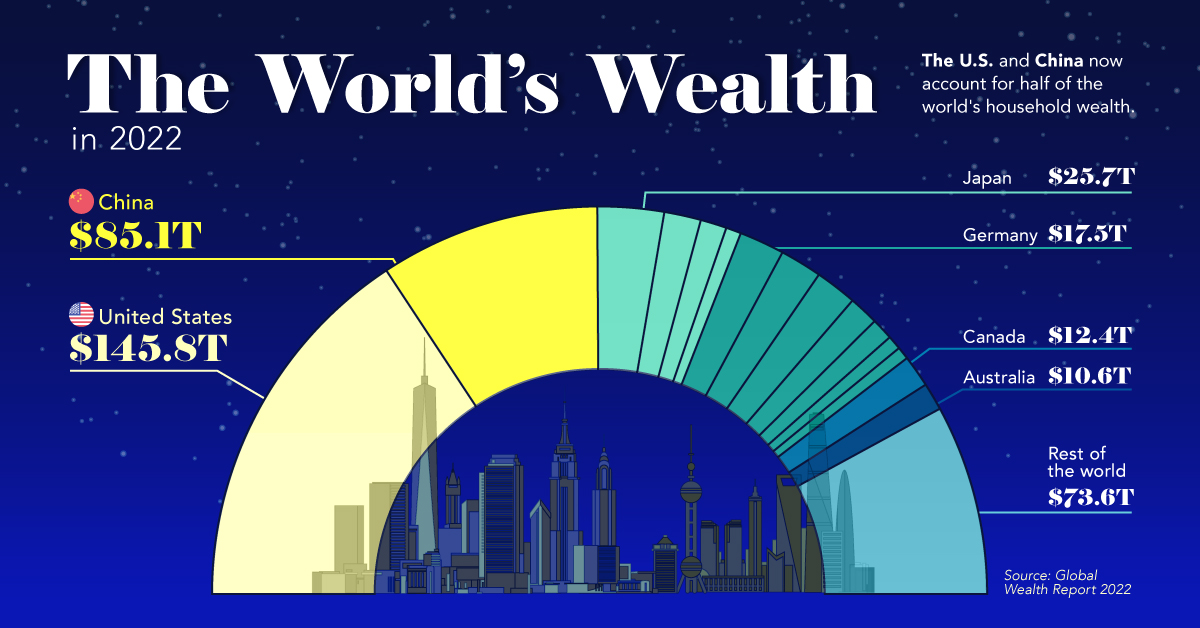
The U.S. and China Account for Half the World’s Household Wealth


The U.S. and China Account for Half the World’s Household Wealth
Measures like GDP are commonly used to understand the overall wealth and size of the economy. While looking at economic output on an annual basis is useful, there are other metrics to consider when evaluating the wealth of a nation.
Household wealth statistics reveal which country’s citizens are accruing the highest level of money and assets worldwide.
This visual utilizes data from Credit Suisse’s annual Global Wealth Report to break down the latest estimates for household wealth by country.
Household Wealth, by Country
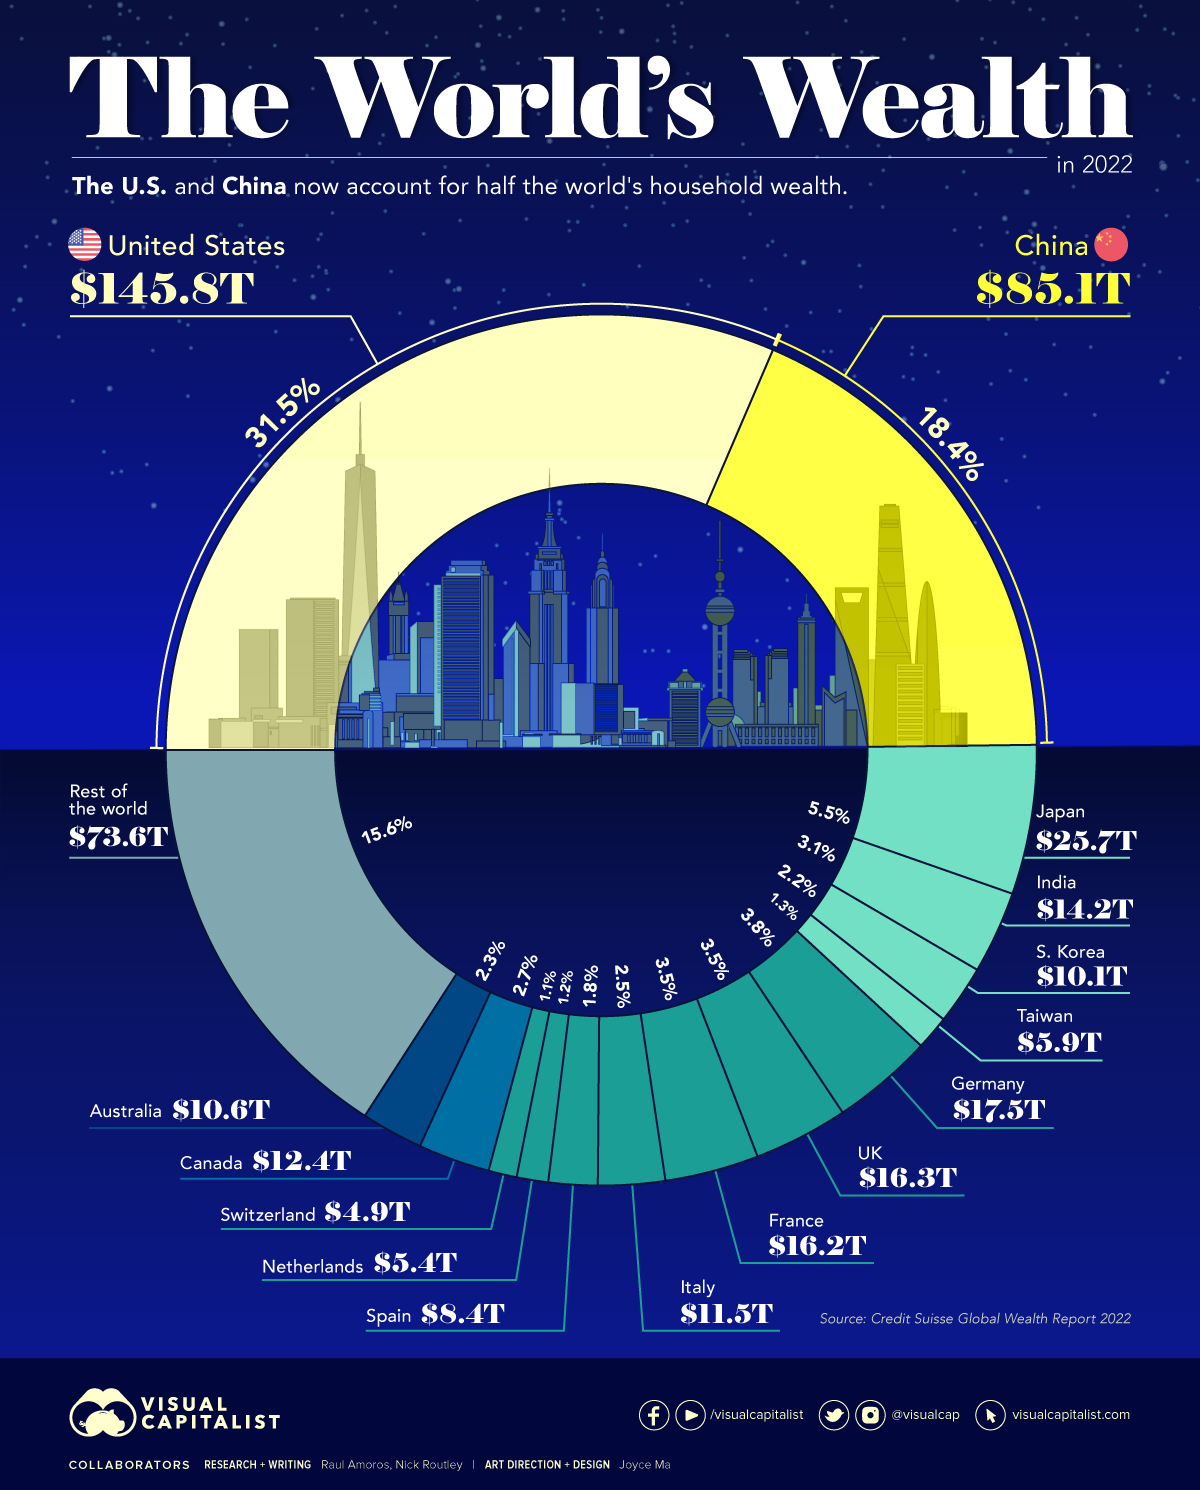
Here’s how the world’s $463 trillion in household wealth is distributed:
| Rank | Country | Household Wealth (2022) | % of World Total |
|---|---|---|---|
| #1 | 🇺🇸 United States | $145.8T | 31.5% |
| #2 | 🇨🇳 China | $85.1T | 18.4% |
| #3 | 🇯🇵 Japan | $25.7T | 5.5% |
| #4 | 🇩🇪 Germany | $17.5T | 3.8% |
| #5 | 🇬🇧 United Kingdom | $16.3T | 3.5% |
| #6 | 🇫🇷 France | $16.2T | 3.5% |
| #7 | 🇮🇳 India | $14.2T | 3.1% |
| #8 | 🇨🇦 Canada | $12.4T | 2.7% |
| #9 | 🇮🇹 Italy | $11.5T | 2.5% |
| #10 | 🇦🇺 Australia | $10.6T | 2.3% |
| #11 | 🇰🇷 South Korea | $10.1T | 2.2% |
| #12 | 🇪🇸 Spain | $8.4T | 1.8% |
| #13 | 🇹🇼 Taiwan | $5.9T | 1.3% |
| #14 | 🇳🇱 Netherlands | $5.4T | 1.2% |
| #15 | 🇨🇭 Switzerland | $4.9T | 1.1% |
| Rest of World | $73.6T | 15.6% | |
| Total: | $463.6T | 100.0% |
As the table above demonstrates, global household wealth is far from being distributed equally.
Country-Level Wealth Concentration
Much of global wealth is concentrated in the biggest economies, with households in China and the U.S. combining to make up half of all personal wealth in the world. This differs slightly from using GDP as a measure, where the U.S. and China make up 24% and 19% of the world economy in nominal terms, respectively.
Today, just 10 countries account for 75% of total household wealth.
One of the biggest changes in recent years is the rise of wealth in China. A decade ago, China’s citizens were estimated to hold just 9% of the world’s wealth. That figure has now more than doubled, while median wealth in the country has skyrocketed from $3,111 to $26,752 between 2000 and 2021.
A Regional Look at Household Wealth
From a regional standpoint, wealth is equally split three ways, between North America, Asia, and everywhere else.
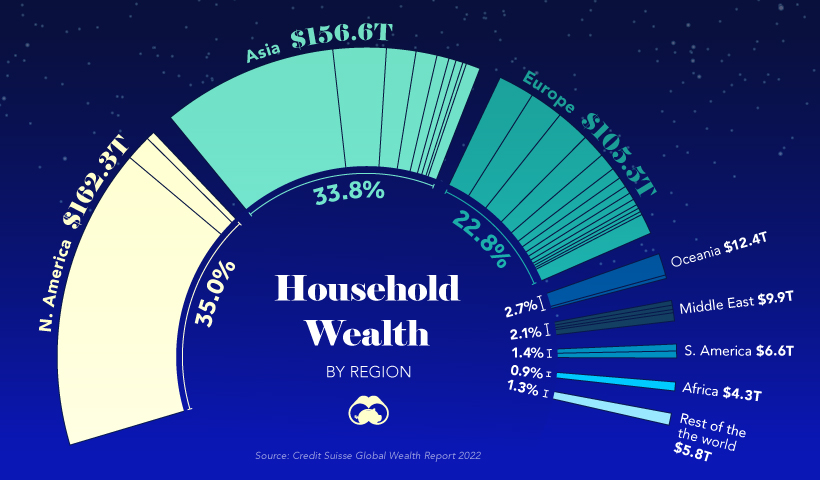
In just one decade, Europe’s share of household wealth dropped by eight percentage points, which is due, in part, to the economic momentum of China.
Surprisingly, the regions of Africa, South America, Oceania, and the Middle East combine only for about 11% of the world’s total household wealth.
Where does this data come from?
Source: Global Wealth Report by Credit Suisse
Data note: There is no straightforward way of estimating household wealth in various countries, so the report utilizes three main measures including: a country’s average level of wealth, the patterns of a country’s wealth holdings, and Forbes list of billionaires.


Markets
Top 10 Countries Most in Debt to the IMF
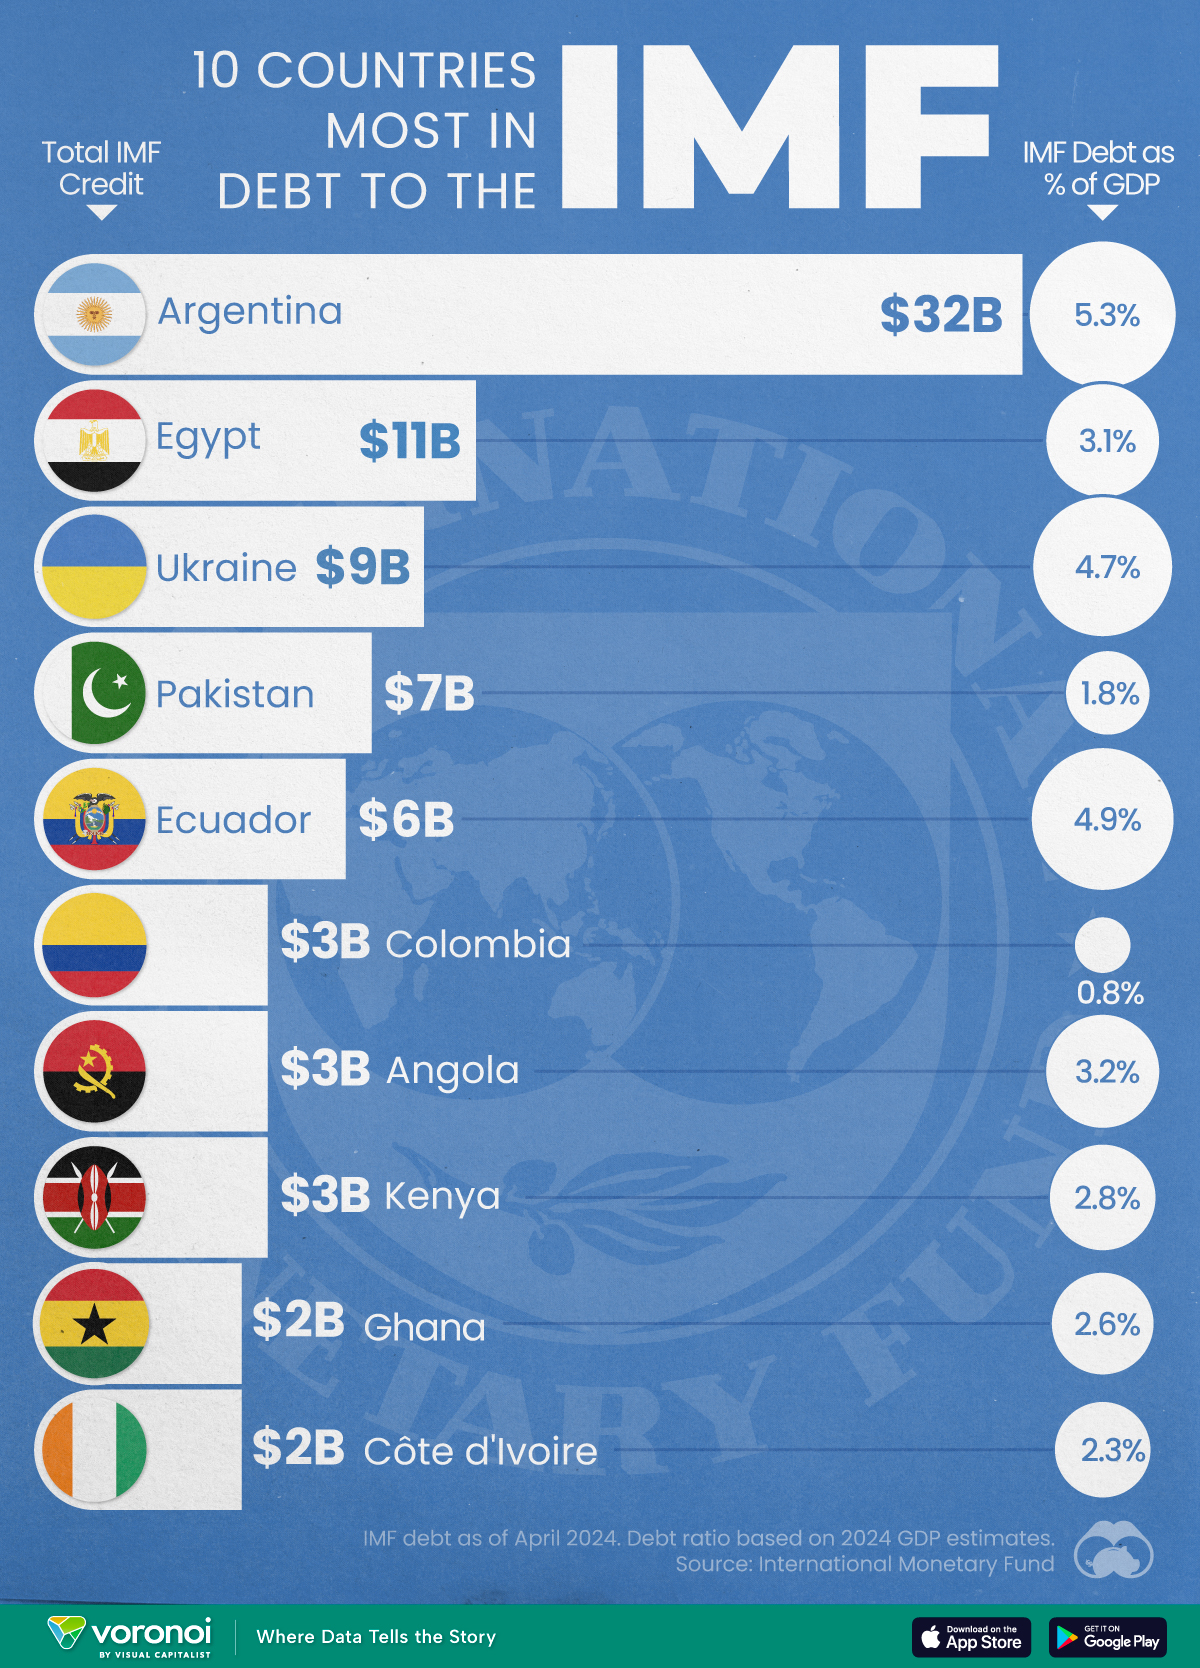
Argentina tops the ranking, with a debt equivalent to 5.3% of the country’s GDP.
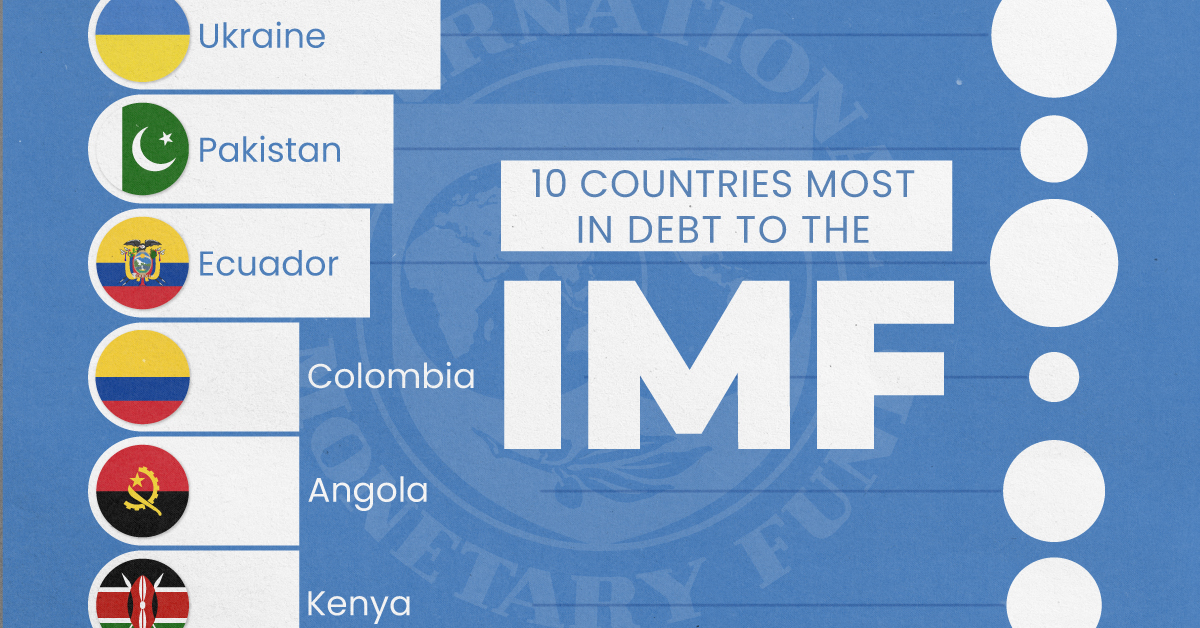
Top 10 Countries Most in Debt to the IMF
This was originally posted on our Voronoi app. Download the app for free on iOS or Android and discover incredible data-driven charts from a variety of trusted sources.
Established in 1944, the International Monetary Fund (IMF) supports countries’ economic growth by providing financial aid and guidance on policies to enhance stability, productivity, and job opportunities.
Countries seek loans from the IMF to address economic crises, stabilize their currencies, implement structural reforms, and alleviate balance of payments difficulties.
In this graphic, we visualize the 10 countries most indebted to the fund.
Methodology
We compiled this ranking using the International Monetary Fund’s data on Total IMF Credit Outstanding. We selected the latest debt data for each country, accurate as of April 29, 2024.
Argentina Tops the Rank
Argentina’s debt to the IMF is equivalent to 5.3% of the country’s GDP. In total, the country owns more than $32 billion.
| Country | IMF Credit Outstanding ($B) | GDP ($B, 2024) | IMF Debt as % of GDP |
|---|---|---|---|
| 🇦🇷 Argentina | 32 | 604.3 | 5.3 |
| 🇪🇬 Egypt | 11 | 347.6 | 3.1 |
| 🇺🇦 Ukraine | 9 | 188.9 | 4.7 |
| 🇵🇰 Pakistan | 7 | 374.7 | 1.8 |
| 🇪🇨 Ecuador | 6 | 121.6 | 4.9 |
| 🇨🇴 Colombia | 3 | 386.1 | 0.8 |
| 🇦🇴 Angola | 3 | 92.1 | 3.2 |
| 🇰🇪 Kenya | 3 | 104.0 | 2.8 |
| 🇬🇭 Ghana | 2 | 75.2 | 2.6 |
| 🇨🇮 Ivory Coast | 2 | 86.9 | 2.3 |
A G20 member and major grain exporter, the country’s history of debt trouble dates back to the late 1890s when it defaulted after contracting debts to modernize the capital, Buenos Aires. It has already been bailed out over 20 times in the last six decades by the IMF.
Five of the 10 most indebted countries are in Africa, while three are in South America.
The only European country on our list, Ukraine has relied on international support amidst the conflict with Russia. It is estimated that Russia’s full-scale invasion of the country caused the loss of a third of the country’s economy. The country owes $9 billion to the IMF.
In total, almost 100 countries owe money to the IMF, and the grand total of all of these debts is $111 billion. The above countries (top 10) account for about 69% of these debts.

-

 Maps7 days ago
Mapped: Southeast Asia’s GDP Per Capita, by Country
-

 Markets2 weeks ago
Visualizing Global Inflation Forecasts (2024-2026)
-

 United States2 weeks ago
Charted: What Southeast Asia Thinks About China & the U.S.
-

 United States2 weeks ago
The Evolution of U.S. Beer Logos
-

 Healthcare1 week ago
What Causes Preventable Child Deaths?
-

 Energy1 week ago
Who’s Building the Most Solar Energy?
-

 Markets1 week ago
Mapped: The Most Valuable Company in Each Southeast Asian Country
-

 Technology1 week ago
Mapped: The Number of AI Startups By Country