Misc
The Psychology of Prices
The Psychology of Prices
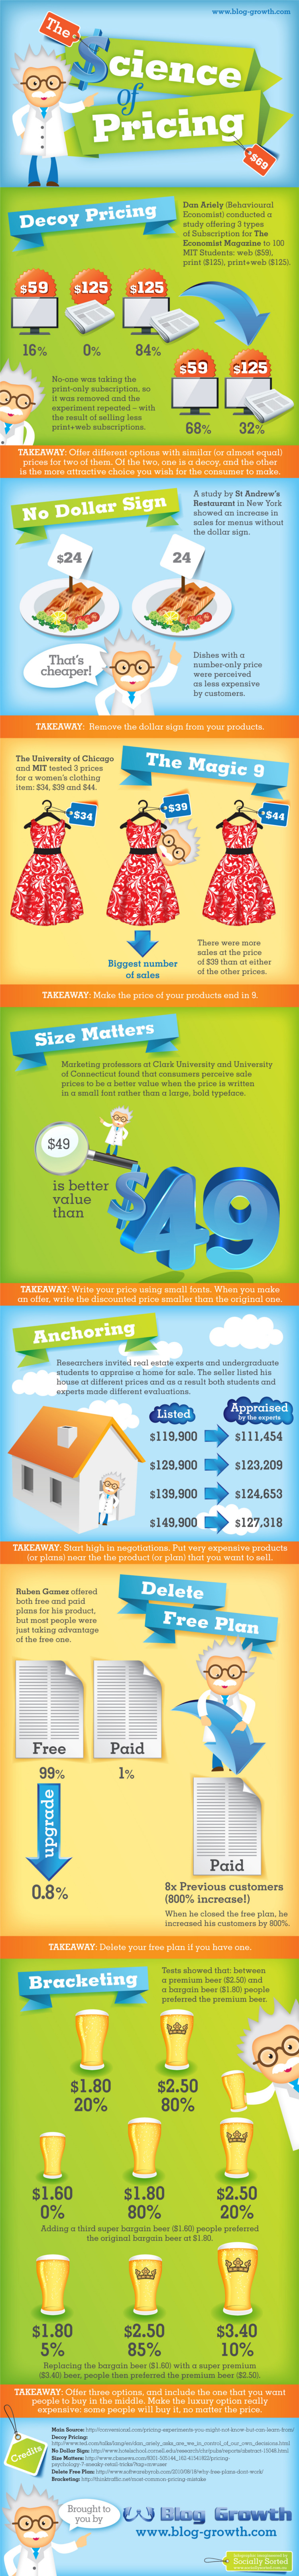
The fascinating infographic we share today focuses in on the psychology of pricing strategy.
In other words: do the actual pricing options provided to a consumer influence overall buying behavior? It turns out the answer to that is a “yes”, and studies show that the extent to which it is a factor in buying decisions is actually very significant.
Aside from just being interesting information, we reckon that there is a parallel with finance and investing as well that may be worth a look.
Investors, like customers, like to get value with what they buy. That’s why, ultimately, the option they choose is a reflection of the prices offered to them as well as the perceived value of each option.
This “perceived value” changes based on the options offered. For example, when potential customers are offered only two subscription options for The Economist (web-only or web + print), only 32% of students would take the more expensive web + print edition. However, when a “decoy” option was added in, offering the print-only edition at a similar price, the amount of web + print subscriptions jumped from 32% to 84%.
What biases do investors or speculators have towards securities that are perceived to have “value” in a given instance?
This is a question worth some self-reflection, because sometimes investors can be their own worst enemies.
Original graphics by: Blog-Growth


Misc
The Top 25 Nationalities of U.S. Immigrants
Mexico is the largest source of immigrants to the U.S., with almost 11 million immigrants.


The Top 25 Nationalities of U.S. Immigrants
This was originally posted on our Voronoi app. Download the app for free on iOS or Android and discover incredible data-driven charts from a variety of trusted sources.
The United States is home to more than 46 million immigrants, constituting approximately 14% of its total population.
This graphic displays the top 25 countries of origin for U.S. immigrants, based on 2022 estimates. The data is sourced from the Migration Policy Institute (MPI), which analyzed information from the U.S. Census Bureau’s 2022 American Community Survey.
In this context, “immigrants” refer to individuals residing in the United States who were not U.S. citizens at birth.
Mexico Emerges as a Leading Source of Immigration
Mexico stands out as the largest contributor to U.S. immigration due to its geographical proximity and historical ties.
Various economic factors, including wage disparities and employment opportunities, motivate many Mexicans to seek better prospects north of the border.
| Country | Region | # of Immigrants |
|---|---|---|
| 🇲🇽 Mexico | Latin America & Caribbean | 10,678,502 |
| 🇮🇳 India | Asia | 2,839,618 |
| 🇨🇳 China | Asia | 2,217,894 |
| 🇵🇭 Philippines | Asia | 1,982,333 |
| 🇸🇻 El Salvador | Latin America & Caribbean | 1,407,622 |
| 🇻🇳 Vietnam | Asia | 1,331,192 |
| 🇨🇺 Cuba | Latin America & Caribbean | 1,312,510 |
| 🇩🇴 Dominican Republic | Latin America & Caribbean | 1,279,900 |
| 🇬🇹 Guatemala | Latin America & Caribbean | 1,148,543 |
| 🇰🇷 Korea | Asia | 1,045,100 |
| 🇨🇴 Colombia | Latin America & Caribbean | 928,053 |
| 🇭🇳 Honduras | Latin America & Caribbean | 843,774 |
| 🇨🇦 Canada | Northern America | 821,322 |
| 🇯🇲 Jamaica | Latin America & Caribbean | 804,775 |
| 🇭🇹 Haiti | Latin America & Caribbean | 730,780 |
| 🇬🇧 United Kingdom | Europe | 676,652 |
| 🇻🇪 Venezuela | Latin America & Caribbean | 667,664 |
| 🇧🇷 Brazil | Latin America & Caribbean | 618,525 |
| 🇩🇪 Germany | Europe | 537,484 |
| 🇪🇨 Ecuador | Latin America & Caribbean | 518,287 |
| 🇵🇪 Peru | Latin America & Caribbean | 471,988 |
| 🇳🇬 Nigeria | Africa | 448,405 |
| 🇺🇦 Ukraine | Europe | 427,163 |
| 🇮🇷 Iran | Middle East | 407,283 |
| 🇵🇰 Pakistan | Asia | 399,086 |
| Rest of World | 11,637,634 | |
| Total | 46,182,089 |
Mexicans are followed in this ranking by Indians, Chinese, and Filipinos, though most immigrants on this list come from countries in the Latin American and Caribbean region.
On the other hand, only three European countries are among the top sources of U.S. immigrants: the UK, Germany, and Ukraine.
Immigration continues to be a significant factor contributing to the overall growth of the U.S. population. Overall population growth has decelerated over the past decade primarily due to declining birth rates.
Between 2021 and 2022, the increase in the immigrant population accounted for 65% of the total population growth in the U.S., representing 912,000 individuals out of nearly 1.4 million.
If you enjoyed this post, be sure to check out Visualized: Why Do People Immigrate to the U.S.? This visualization shows the different reasons cited by new arrivals to America in 2021.

-

 United States6 days ago
Mapped: Countries Where Recreational Cannabis is Legal
-

 Healthcare2 weeks ago
Life Expectancy by Region (1950-2050F)
-

 Markets2 weeks ago
The Growth of a $1,000 Equity Investment, by Stock Market
-

 Markets2 weeks ago
Mapped: Europe’s GDP Per Capita, by Country
-

 Money2 weeks ago
Charted: What Frustrates Americans About the Tax System
-

 Technology2 weeks ago
Countries With the Highest Rates of Crypto Ownership
-

 Mining2 weeks ago
Where the World’s Aluminum is Smelted, by Country
-

 Personal Finance1 week ago
Visualizing the Tax Burden of Every U.S. State