Misc
Mapped: The World’s Fastest Growing Cities
Mapped: The World’s Fastest Growing Cities
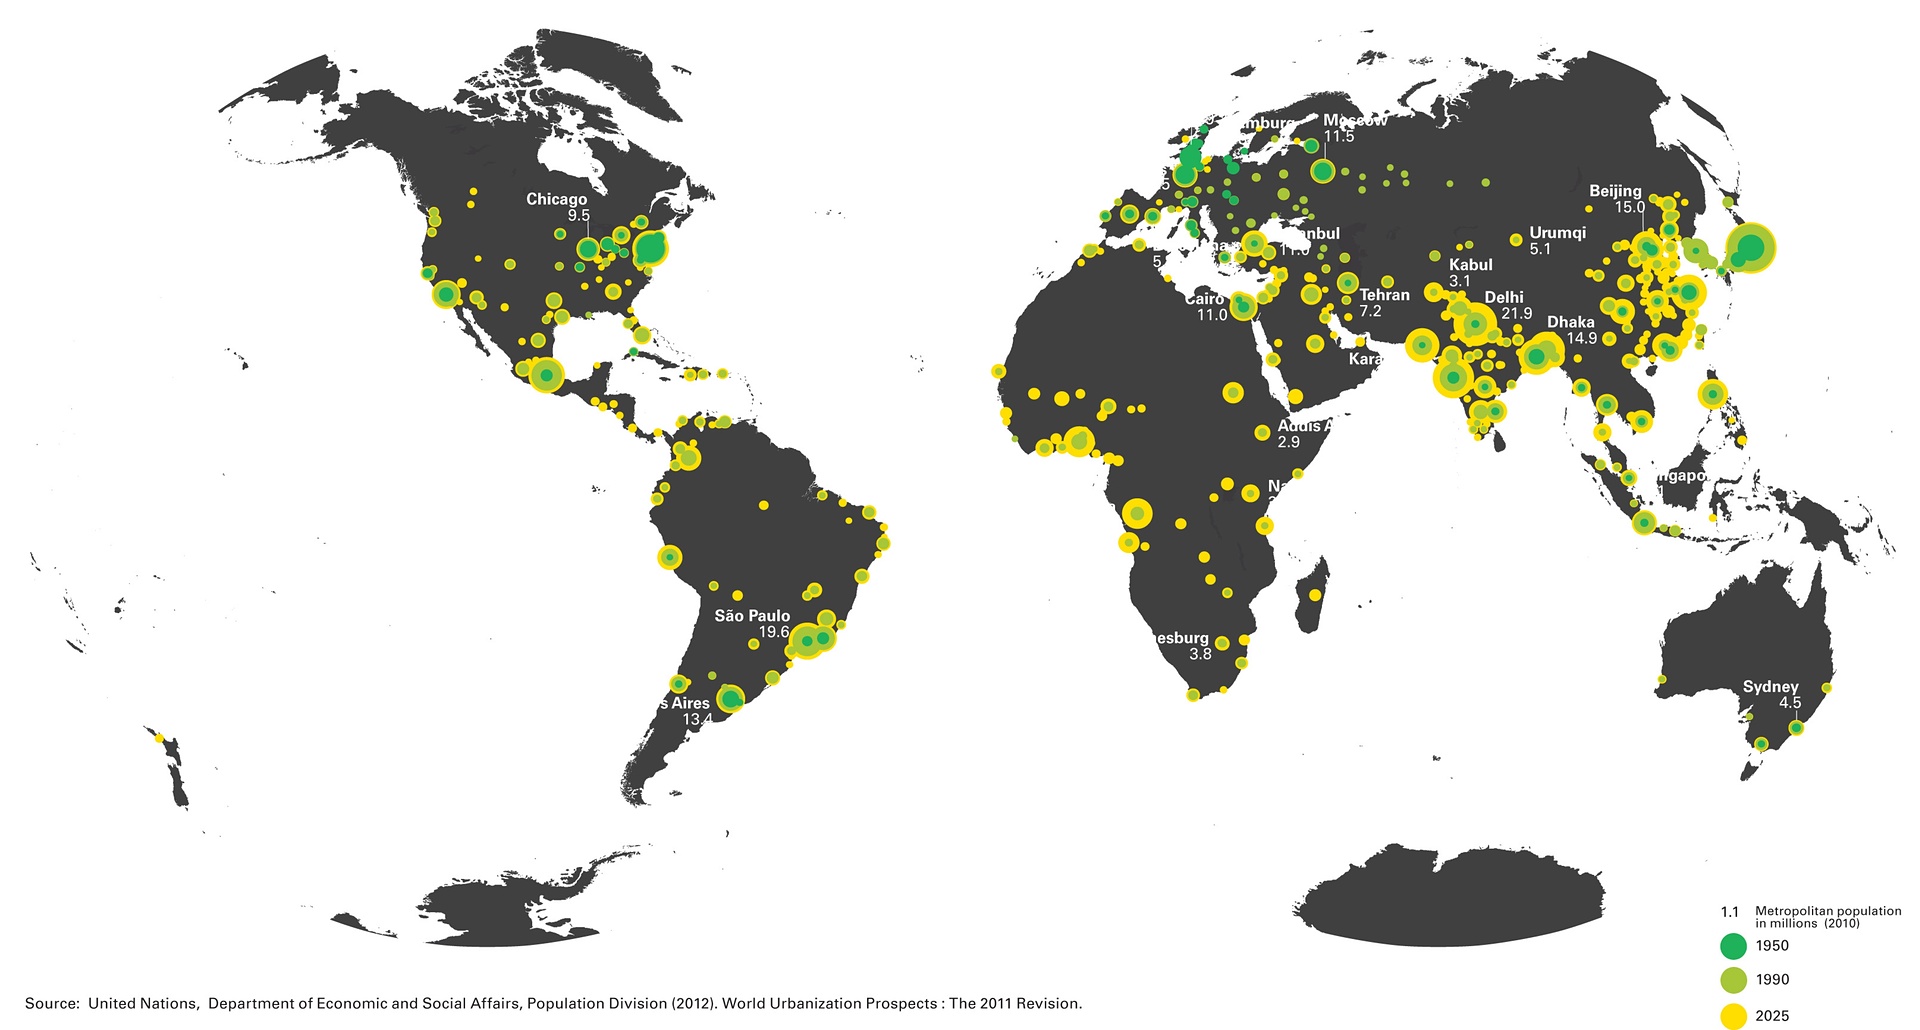
The single most important demographic trend over the last century has been the rapid urbanization of the world. Just as recently as 1950, less than 30% of the total population lived in cities.
By the year 2030? It is expected that 60% of the world will be urbanized.
Highly developed countries already heavily rely on cities. People living in the United States (81%), Canada (82%), Australia (89%), or Germany (75%) mainly reside in urban areas, and there’s good reason for it. Take a look at this 3d map showing GDP contribution by city in the United States and you will notice that places like New York or Los Angeles have massive contributions to economic production. In fact, an impressive 52% of total economic output in the U.S. comes from the top 20 urban areas in the country.
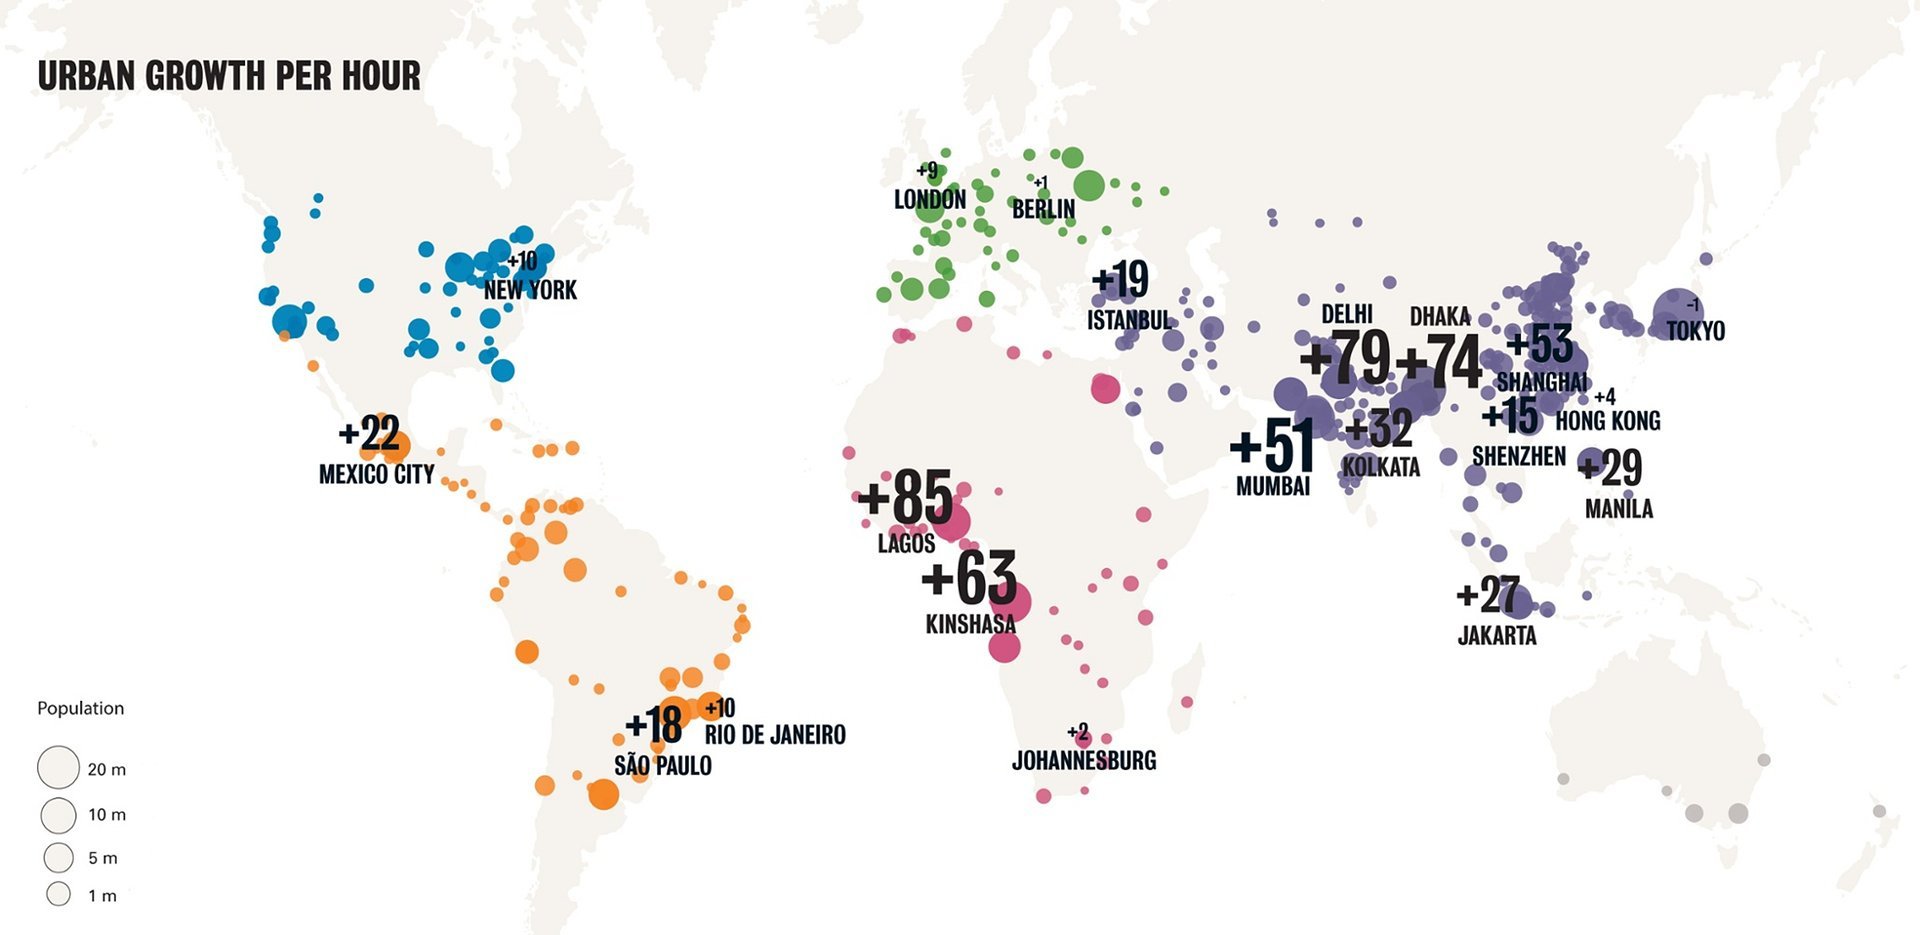
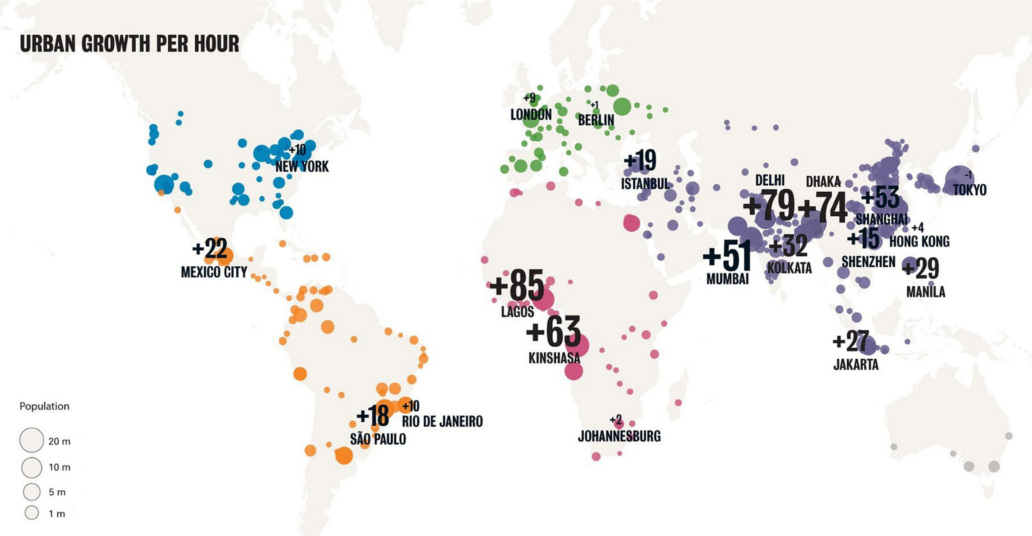
This is true throughout the rest of the world as well. According to McKinsey, the world’s 600 largest cities generate 60% of all economic output. It is this great economic opportunity that is driving people from their farms to the newest urban centers. Specifically, it is in Africa and Asia that the world’s fastest growing cities can be found.
Countries such as China and India are at the forefront of this rapid development. New citizens are joining Delhi at a rate of 79 people per hour, while Shanghai continues to welcome 51 new citizens an hour. Africa will look very different than it has in the past as well. The World Economic Forum pointed out that in 1960 that Johannesburg was the only city in sub-Saharan Africa to have more than 1 million people. Fifty years later, there are 33 cities with more than 1 million in the region.
The world’s fastest growing megacity? It’s Lagos, Nigeria and Fortune calls it the “Big Apple of Africa”. In the 1970s it had a measly 2 million people, but today it boasts 16 million people with a growth rate of 85 new Lagosians per hour.
Original graphic by: The Guardian


Misc
How Hard Is It to Get Into an Ivy League School?
We detail the admission rates and average annual cost for Ivy League schools, as well as the median SAT scores required to be accepted.


How Hard Is It to Get Into an Ivy League School?
This was originally posted on our Voronoi app. Download the app for free on iOS or Android and discover incredible data-driven charts from a variety of trusted sources.
Ivy League institutions are renowned worldwide for their academic excellence and long-standing traditions. But how hard is it to get into one of the top universities in the U.S.?
In this graphic, we detail the admission rates and average annual cost for Ivy League schools, as well as the median SAT scores required to be accepted. The data comes from the National Center for Education Statistics and was compiled by 24/7 Wall St.
Note that “average annual cost” represents the net price a student pays after subtracting the average value of grants and/or scholarships received.
Harvard is the Most Selective
The SAT is a standardized test commonly used for college admissions in the United States. It’s taken by high school juniors and seniors to assess their readiness for college-level academic work.
When comparing SAT scores, Harvard and Dartmouth are among the most challenging universities to gain admission to. The median SAT scores for their students are 760 for reading and writing and 790 for math. Still, Harvard has half the admission rate (3.2%) compared to Dartmouth (6.4%).
| School | Admission rate (%) | SAT Score: Reading & Writing | SAT Score: Math | Avg Annual Cost* |
|---|---|---|---|---|
| Harvard University | 3.2 | 760 | 790 | $13,259 |
| Columbia University | 3.9 | 750 | 780 | $12,836 |
| Yale University | 4.6 | 760 | 780 | $16,341 |
| Brown University | 5.1 | 760 | 780 | $26,308 |
| Princeton University | 5.7 | 760 | 780 | $11,080 |
| Dartmouth College | 6.4 | 760 | 790 | $33,023 |
| University of Pennsylvania | 6.5 | 750 | 790 | $14,851 |
| Cornell University | 7.5 | 750 | 780 | $29,011 |
*Costs after receiving federal financial aid.
Additionally, Dartmouth has the highest average annual cost at $33,000. Princeton has the lowest at $11,100.
While student debt has surged in the United States in recent years, hitting $1.73 trillion in 2023, the worth of obtaining a degree from any of the schools listed surpasses mere academics. This is evidenced by the substantial incomes earned by former students.
Harvard grads, for example, have the highest average starting salary in the country, at $91,700.

-

 Real Estate2 weeks ago
Visualizing America’s Shortage of Affordable Homes
-

 Technology1 week ago
Ranked: Semiconductor Companies by Industry Revenue Share
-

 Money1 week ago
Which States Have the Highest Minimum Wage in America?
-

 Real Estate1 week ago
Ranked: The Most Valuable Housing Markets in America
-

 Business2 weeks ago
Charted: Big Four Market Share by S&P 500 Audits
-

 AI2 weeks ago
The Stock Performance of U.S. Chipmakers So Far in 2024
-

 Misc2 weeks ago
Almost Every EV Stock is Down After Q1 2024
-

 Money2 weeks ago
Where Does One U.S. Tax Dollar Go?