Markets
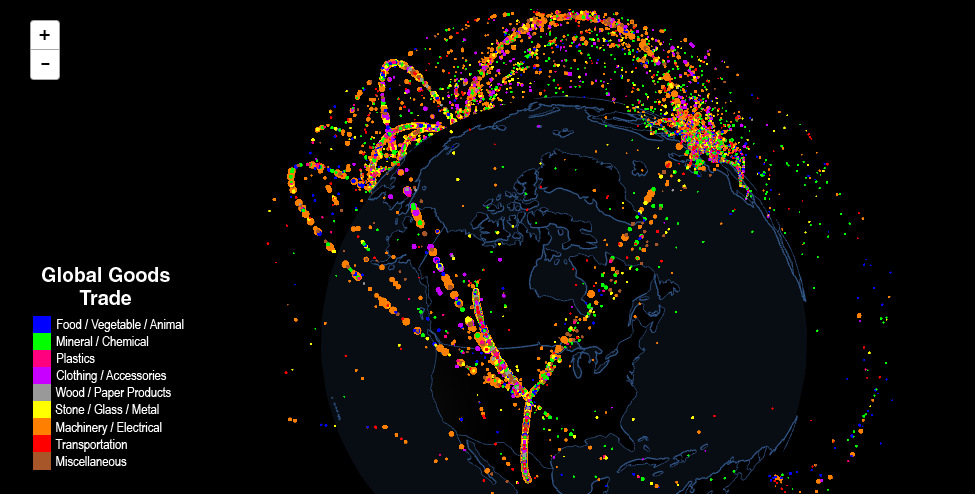
Interactive Map: The Flow of International Trade
Click on a country to see its share of trade alone, or spin/navigate the globe by using your mouse.
Interactive: Mapping the Flow of International Trade
The interactive visualization you see in this post was created by data visualization expert Max Galka from the Metrocosm blog. (Also check out his new project, Blueshift, which allows users to upload data and visualize it on maps with no coding required.)
Trade is an essential part of economic prosperity, but how much do you know about global trade?
Today’s visualization helps to map international trade on a 3D globe, plotting the exchange of goods between countries. It enables the abstract concept of trade to become more tactile, and at the same time the visuals make it easier to absorb information.
Exploring the Map
The great thing about interactive maps is that they allow you to take control.
Here are a few things we found particularly interesting, as we scanned through the map:
- When looking at the globe as a whole, trade is concentrated into obvious hubs. The United States, Europe, and China/Japan are the most evident ones, and they are all lit up with color.
- There are also obvious have-nots. Take a look at most of the countries in Africa, or click on an individual country like North Korea to see a lack of international trade.
- In fact, North Korea is completely vacuous, except for one lonely dot floating to China every so often. After taking a quick look at the data, it seems China takes in over 60% of North Korea’s exports, which are mostly raw materials such as coal, iron ore, or pig iron.
- Now click on South Korea, and the situation is completely different. By the way, South Korea exports $583 billion of goods per year, while the hermit nation does just $3.1 billion per year.
- This map also shows how dependent some countries are on others for trade. Look at Canada, a country that sends close to 75% of its exports to the United States. Mexico has a similar situation, where it does most of its business with the U.S. as well.
- This is a stark contrast to Cuba, which doesn’t trade enough with any one partner to have it visualized on this scale at all. Cuba has exports of only $1.7 billion, and its largest trading partner is China, which only takes in $311 million of goods per year.
Want to see more on international trade? Check out this set of maps that shows China’s rising dominance in trade, or the flow of oil around the world.


Maps
Mapped: The 10 U.S. States With the Lowest Real GDP Growth
In this graphic, we show where real GDP lagged the most across America in 2023 as high interest rates weighed on state economies.


The Top 10 U.S. States, by Lowest Real GDP Growth
This was originally posted on our Voronoi app. Download the app for free on iOS or Android and discover incredible data-driven charts from a variety of trusted sources.
While the U.S. economy defied expectations in 2023, posting 2.5% in real GDP growth, several states lagged behind.
Last year, oil-producing states led the pack in terms of real GDP growth across America, while the lowest growth was seen in states that were more sensitive to the impact of high interest rates, particularly due to slowdowns in the manufacturing and finance sectors.
This graphic shows the 10 states with the least robust real GDP growth in 2023, based on data from the Bureau of Economic Analysis.
Weakest State Economies in 2023
Below, we show the states with the slowest economic activity in inflation-adjusted terms, using chained 2017 dollars:
| Rank | State | Real GDP Growth 2023 YoY | Real GDP 2023 |
|---|---|---|---|
| 1 | Delaware | -1.2% | $74B |
| 2 | Wisconsin | +0.2% | $337B |
| 3 | New York | +0.7% | $1.8T |
| 4 | Missississippi | +0.7% | $115B |
| 5 | Georgia | +0.8% | $661B |
| 6 | Minnesota | +1.2% | $384B |
| 7 | New Hampshire | +1.2% | $91B |
| 8 | Ohio | +1.2% | $698B |
| 9 | Iowa | +1.3% | $200B |
| 10 | Illinois | +1.3% | $876B |
| U.S. | +2.5% | $22.4T |
Delaware witnessed the slowest growth in the country, with real GDP growth of -1.2% over the year as a sluggish finance and insurance sector dampened the state’s economy.
Like Delaware, the Midwestern state of Wisconsin also experienced declines across the finance and insurance sector, in addition to steep drops in the agriculture and manufacturing industries.
America’s third-biggest economy, New York, grew just 0.7% in 2023, falling far below the U.S. average. High interest rates took a toll on key sectors, with notable slowdowns in the construction and manufacturing sectors. In addition, falling home prices and a weaker job market contributed to slower economic growth.
Meanwhile, Georgia experienced the fifth-lowest real GDP growth rate. In March 2024, Rivian paused plans to build a $5 billion EV factory in Georgia, which was set to be one of the biggest economic development initiatives in the state in history.
These delays are likely to exacerbate setbacks for the state, however, both Kia and Hyundai have made significant investments in the EV industry, which could help boost Georgia’s manufacturing sector looking ahead.

-

 Personal Finance1 week ago
Visualizing the Tax Burden of Every U.S. State
-

 Misc6 days ago
Visualized: Aircraft Carriers by Country
-

 Culture6 days ago
How Popular Snack Brand Logos Have Changed
-

 Mining1 week ago
Visualizing Copper Production by Country in 2023
-

 Misc1 week ago
Charted: How Americans Feel About Federal Government Agencies
-

 Healthcare1 week ago
Which Countries Have the Highest Infant Mortality Rates?
-

 Demographics1 week ago
Mapped: U.S. Immigrants by Region
-

 Maps1 week ago
Mapped: Southeast Asia’s GDP Per Capita, by Country