Markets
Which Countries Hold the Most U.S. Debt?
Which Countries Hold the Most U.S. Debt in 2022?
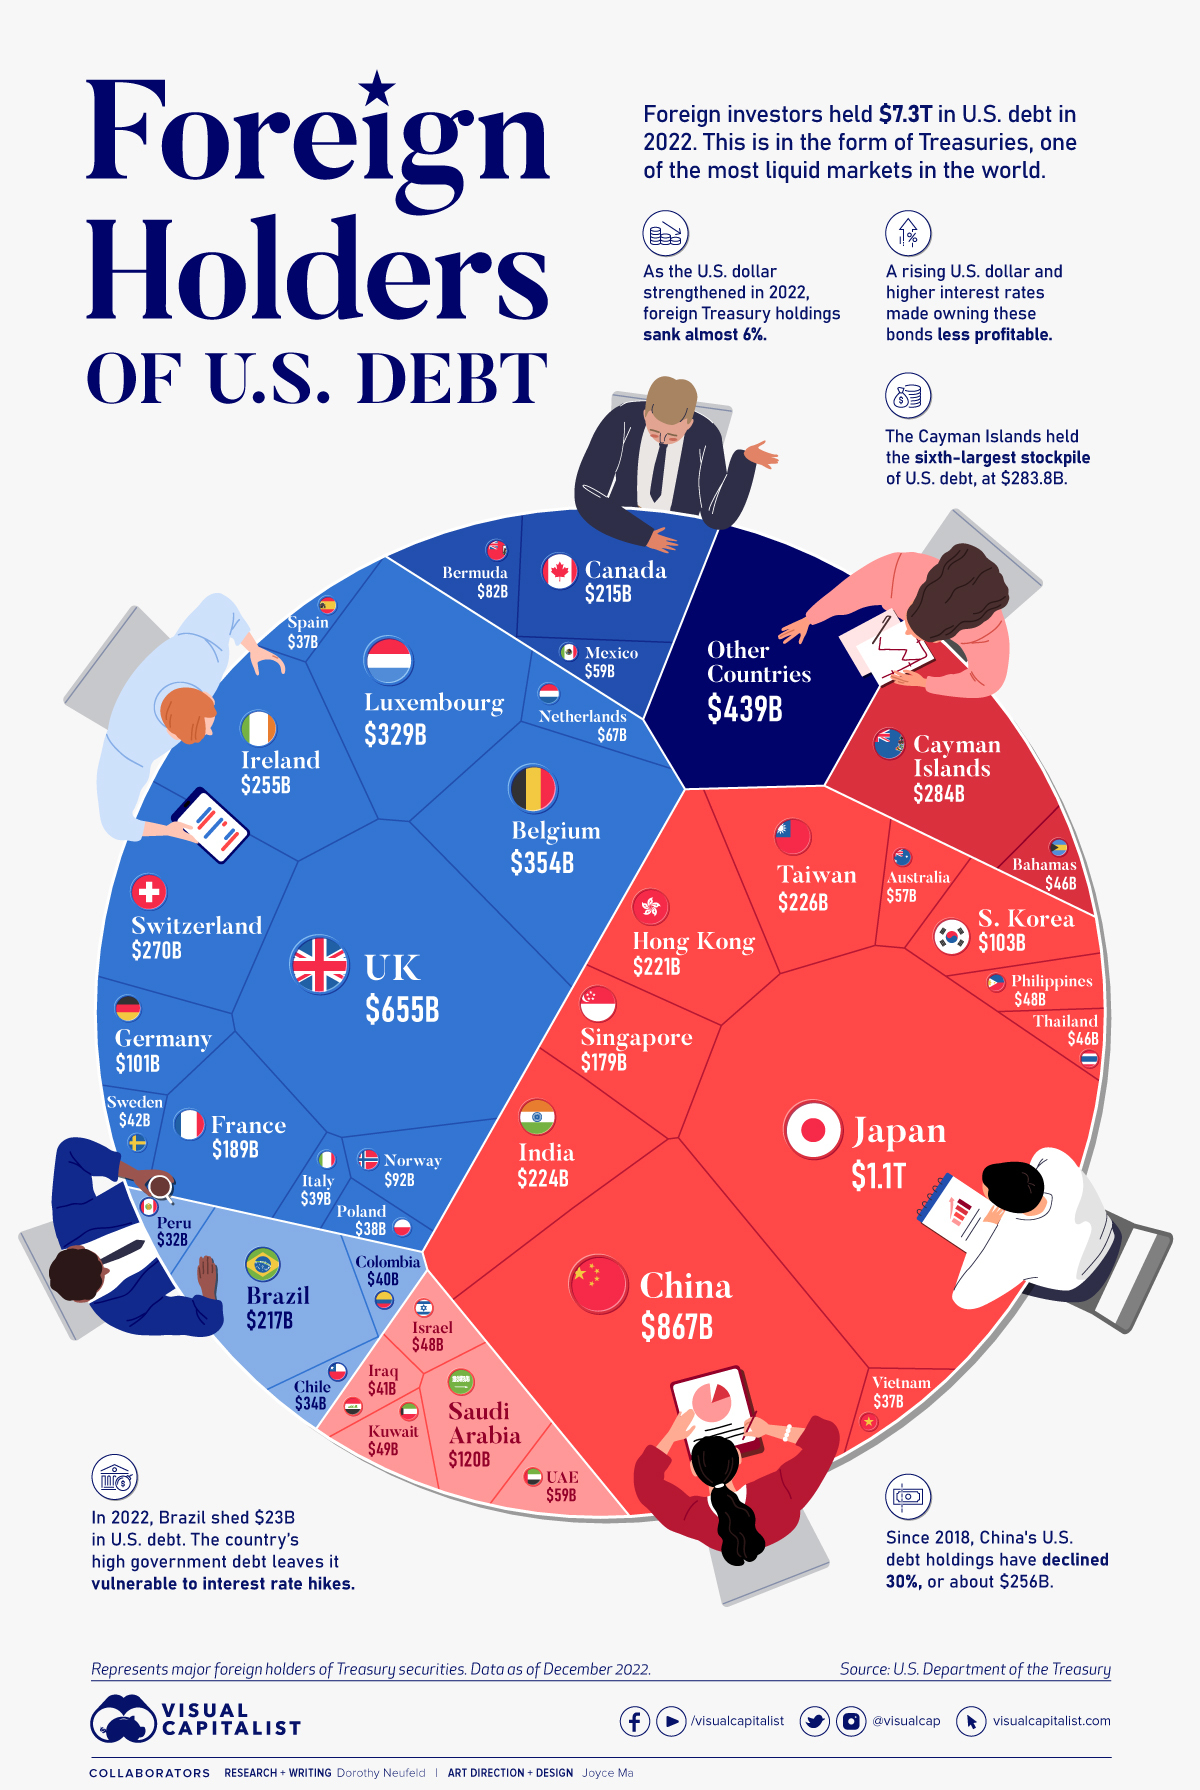
Today, America owes foreign investors of its national debt $7.3 trillion.
These are in the form of Treasury securities, some of the most liquid assets worldwide. Central banks use them for foreign exchange reserves and private investors flock to them during flights to safety thanks to their perceived low default risk.
Beyond these reasons, foreign investors may buy Treasuries as a store of value. They are often used as collateral during certain international trade transactions, or countries can use them to help manage exchange rate policy. For example, countries may buy Treasuries to protect their currency’s exchange rate from speculation.
In the above graphic, we show the foreign holders of the U.S. national debt using data from the U.S. Department of the Treasury.
Top Foreign Holders of U.S. Debt
With $1.1 trillion in Treasury holdings, Japan is the largest foreign holder of U.S. debt.
Japan surpassed China as the top holder in 2019 as China shed over $250 billion, or 30% of its holdings in four years.
This bond offloading by China is the one way the country can manage the yuan’s exchange rate. This is because if it sells dollars, it can buy the yuan when the currency falls. At the same time, China doesn’t solely use the dollar to manage its currency—it now uses a basket of currencies.
Here are the countries that hold the most U.S. debt:
| Rank | Country | U.S. Treasury Holdings | Share of Total |
|---|---|---|---|
| 1 | 🇯🇵 Japan | $1,076B | 14.7% |
| 2 | 🇨🇳 China | $867B | 11.9% |
| 3 | 🇬🇧 United Kingdom | $655B | 8.9% |
| 4 | 🇧🇪 Belgium | $354B | 4.8% |
| 5 | 🇱🇺 Luxembourg | $329B | 4.5% |
| 6 | 🇰🇾 Cayman Islands | $284B | 3.9% |
| 7 | 🇨🇭 Switzerland | $270B | 3.7% |
| 8 | 🇮🇪 Ireland | $255B | 3.5% |
| 9 | 🇹🇼 Taiwan | $226B | 3.1% |
| 10 | 🇮🇳 India | $224B | 3.1% |
| 11 | 🇭🇰 Hong Kong | $221B | 3.0% |
| 12 | 🇧🇷 Brazil | $217B | 3.0% |
| 13 | 🇨🇦 Canada | $215B | 2.9% |
| 14 | 🇫🇷 France | $189B | 2.6% |
| 15 | 🇸🇬 Singapore | $179B | 2.4% |
| 16 | 🇸🇦 Saudi Arabia | $120B | 1.6% |
| 17 | 🇰🇷 South Korea | $103B | 1.4% |
| 18 | 🇩🇪 Germany | $101B | 1.4% |
| 19 | 🇳🇴 Norway | $92B | 1.3% |
| 20 | 🇧🇲 Bermuda | $82B | 1.1% |
| 21 | 🇳🇱 Netherlands | $67B | 0.9% |
| 22 | 🇲🇽 Mexico | $59B | 0.8% |
| 23 | 🇦🇪 UAE | $59B | 0.8% |
| 24 | 🇦🇺 Australia | $57B | 0.8% |
| 25 | 🇰🇼 Kuwait | $49B | 0.7% |
| 26 | 🇵🇭 Philippines | $48B | 0.7% |
| 27 | 🇮🇱 Israel | $48B | 0.7% |
| 28 | 🇧🇸 Bahamas | $46B | 0.6% |
| 29 | 🇹🇭 Thailand | $46B | 0.6% |
| 30 | 🇸🇪 Sweden | $42B | 0.6% |
| 31 | 🇮🇶 Iraq | $41B | 0.6% |
| 32 | 🇨🇴 Colombia | $40B | 0.5% |
| 33 | 🇮🇹 Italy | $39B | 0.5% |
| 34 | 🇵🇱 Poland | $38B | 0.5% |
| 35 | 🇪🇸 Spain | $37B | 0.5% |
| 36 | 🇻🇳 Vietnam | $37B | 0.5% |
| 37 | 🇨🇱 Chile | $34B | 0.5% |
| 38 | 🇵🇪 Peru | $32B | 0.4% |
| All Other | $439B | 6.0% |
As the above table shows, the United Kingdom is the third highest holder, at over $655 billion in Treasuries. Across Europe, 13 countries are notable holders of these securities, the highest in any region, followed by Asia-Pacific at 11 different holders.
A handful of small nations own a surprising amount of U.S. debt. With a population of 70,000, the Cayman Islands own a towering amount of Treasury bonds to the tune of $284 billion. There are more hedge funds domiciled in the Cayman Islands per capita than any other nation worldwide.
In fact, the four smallest nations in the visualization above—Cayman Islands, Bermuda, Bahamas, and Luxembourg—have a combined population of just 1.2 million people, but own a staggering $741 billion in Treasuries.
Interest Rates and Treasury Market Dynamics
Over 2022, foreign demand for Treasuries sank 6% as higher interest rates and a strong U.S. dollar made owning these bonds less profitable.
This is because rising interest rates on U.S. debt makes the present value of their future income payments lower. Meanwhile, their prices also fall.
As the chart below shows, this drop in demand is a sharp reversal from 2018-2020, when demand jumped as interest rates hovered at historic lows. A similar trend took place in the decade after the 2008-09 financial crisis when U.S. debt holdings effectively tripled from $2 to $6 trillion.
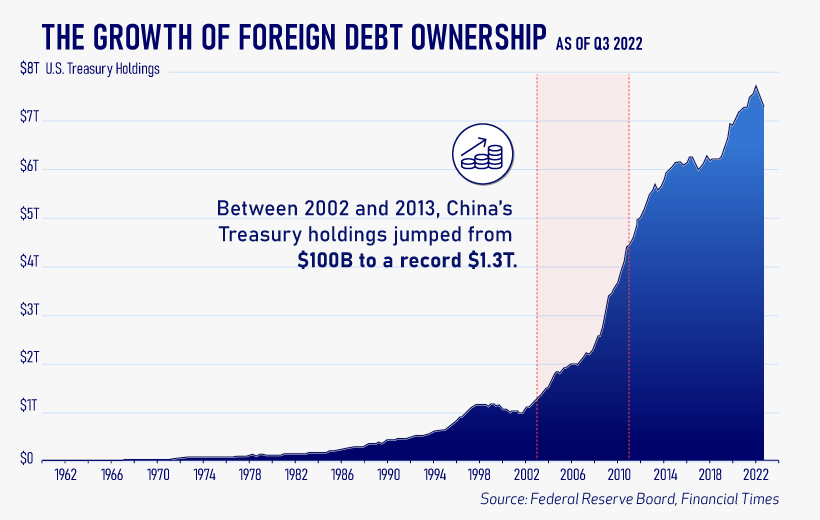
Driving this trend was China’s rapid purchase of Treasuries, which ballooned from $100 billion in 2002 to a peak of $1.3 trillion in 2013. As the country’s exports and output expanded, it sold yuan and bought dollars to help alleviate exchange rate pressure on its currency.
Fast-forward to today, and global interest-rate uncertainty—which in turn can impact national currency valuations and therefore demand for Treasuries—continues to be a factor impacting the future direction of foreign U.S. debt holdings.
Maps
Mapped: The 10 U.S. States With the Lowest Real GDP Growth
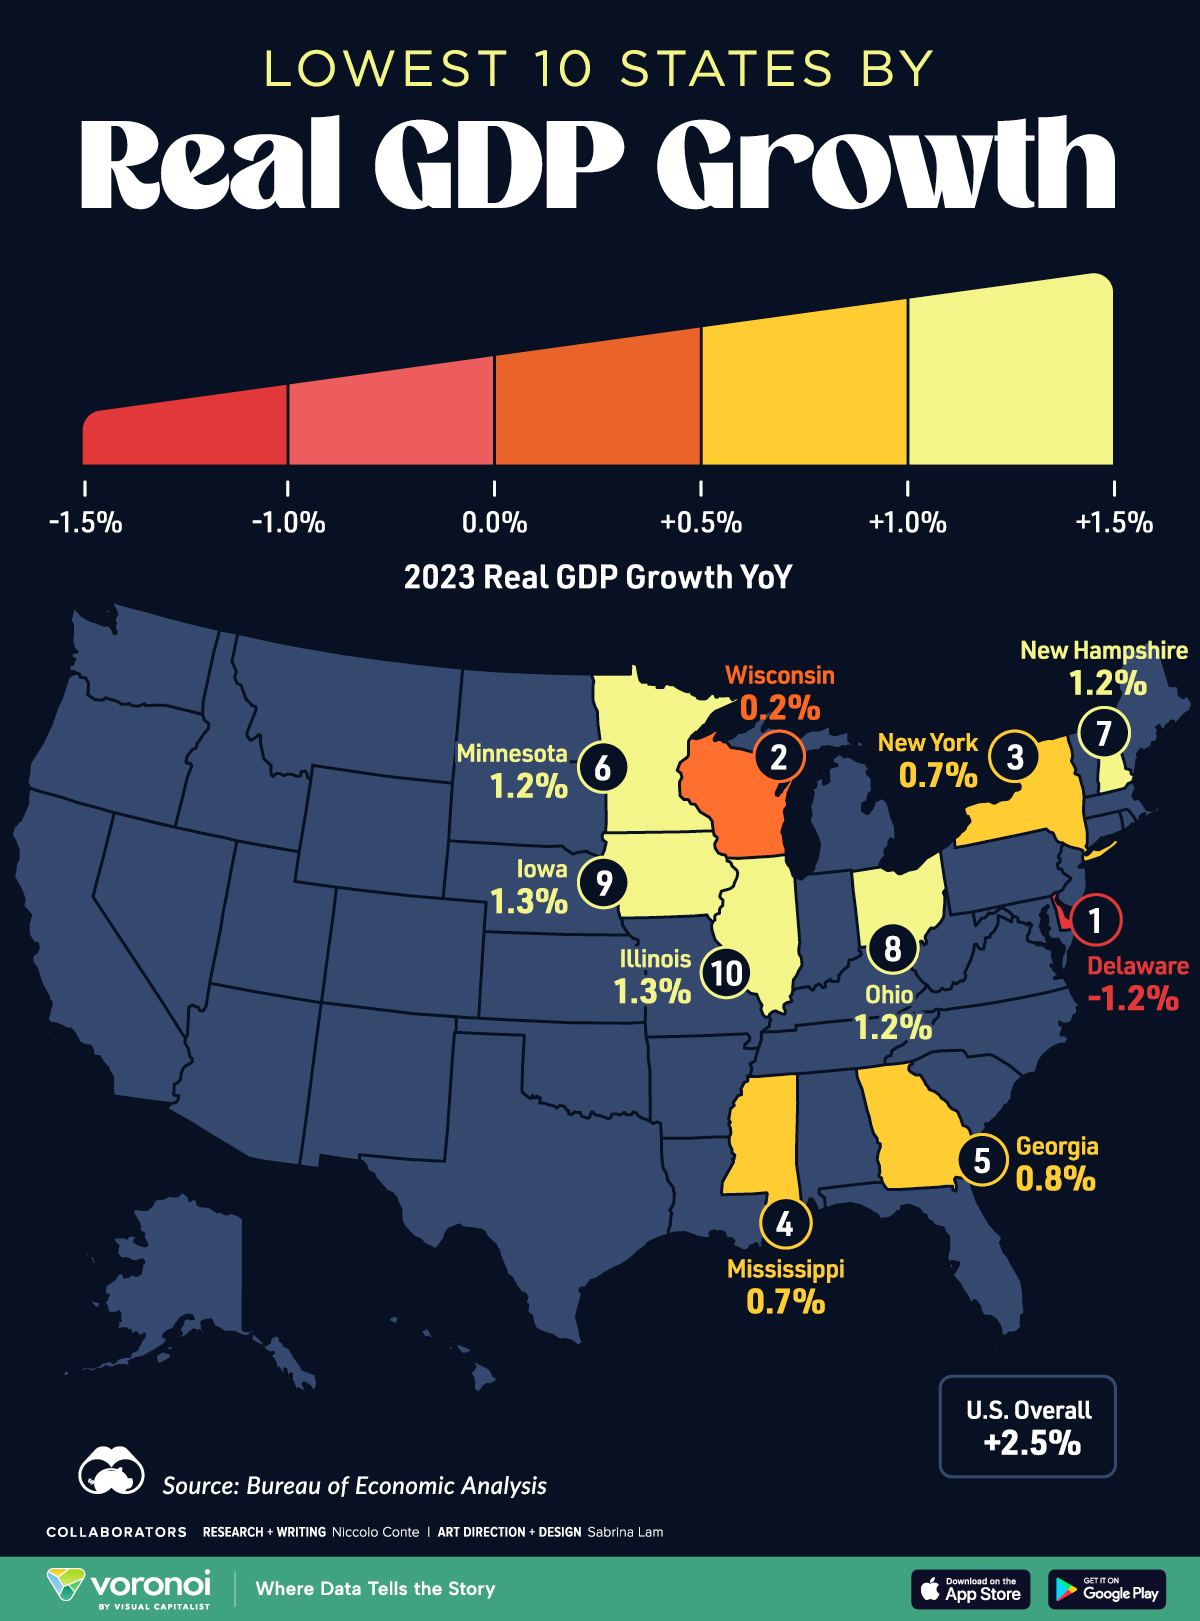
In this graphic, we show where real GDP lagged the most across America in 2023 as high interest rates weighed on state economies.

The Top 10 U.S. States, by Lowest Real GDP Growth
This was originally posted on our Voronoi app. Download the app for free on iOS or Android and discover incredible data-driven charts from a variety of trusted sources.
While the U.S. economy defied expectations in 2023, posting 2.5% in real GDP growth, several states lagged behind.
Last year, oil-producing states led the pack in terms of real GDP growth across America, while the lowest growth was seen in states that were more sensitive to the impact of high interest rates, particularly due to slowdowns in the manufacturing and finance sectors.
This graphic shows the 10 states with the least robust real GDP growth in 2023, based on data from the Bureau of Economic Analysis.
Weakest State Economies in 2023
Below, we show the states with the slowest economic activity in inflation-adjusted terms, using chained 2017 dollars:
| Rank | State | Real GDP Growth 2023 YoY | Real GDP 2023 |
|---|---|---|---|
| 1 | Delaware | -1.2% | $74B |
| 2 | Wisconsin | +0.2% | $337B |
| 3 | New York | +0.7% | $1.8T |
| 4 | Missississippi | +0.7% | $115B |
| 5 | Georgia | +0.8% | $661B |
| 6 | Minnesota | +1.2% | $384B |
| 7 | New Hampshire | +1.2% | $91B |
| 8 | Ohio | +1.2% | $698B |
| 9 | Iowa | +1.3% | $200B |
| 10 | Illinois | +1.3% | $876B |
| U.S. | +2.5% | $22.4T |
Delaware witnessed the slowest growth in the country, with real GDP growth of -1.2% over the year as a sluggish finance and insurance sector dampened the state’s economy.
Like Delaware, the Midwestern state of Wisconsin also experienced declines across the finance and insurance sector, in addition to steep drops in the agriculture and manufacturing industries.
America’s third-biggest economy, New York, grew just 0.7% in 2023, falling far below the U.S. average. High interest rates took a toll on key sectors, with notable slowdowns in the construction and manufacturing sectors. In addition, falling home prices and a weaker job market contributed to slower economic growth.
Meanwhile, Georgia experienced the fifth-lowest real GDP growth rate. In March 2024, Rivian paused plans to build a $5 billion EV factory in Georgia, which was set to be one of the biggest economic development initiatives in the state in history.
These delays are likely to exacerbate setbacks for the state, however, both Kia and Hyundai have made significant investments in the EV industry, which could help boost Georgia’s manufacturing sector looking ahead.
-

 Technology1 week ago
Countries With the Highest Rates of Crypto Ownership
-

 Mining6 days ago
Visualizing Copper Production by Country in 2023
-

 Politics7 days ago
Charted: How Americans Feel About Federal Government Agencies
-

 Healthcare1 week ago
Which Countries Have the Highest Infant Mortality Rates?
-

 Demographics1 week ago
Mapped: U.S. Immigrants by Region
-

 Economy1 week ago
Mapped: Southeast Asia’s GDP Per Capita, by Country
-
 Automotive1 week ago
How People Get Around in America, Europe, and Asia
-

 Personal Finance1 week ago
Visualizing the Tax Burden of Every U.S. State


