Personal Finance
Mapped: What You Need to Earn to Own a Home in 50 American Cities
Click to view this graphic in a higher-resolution.
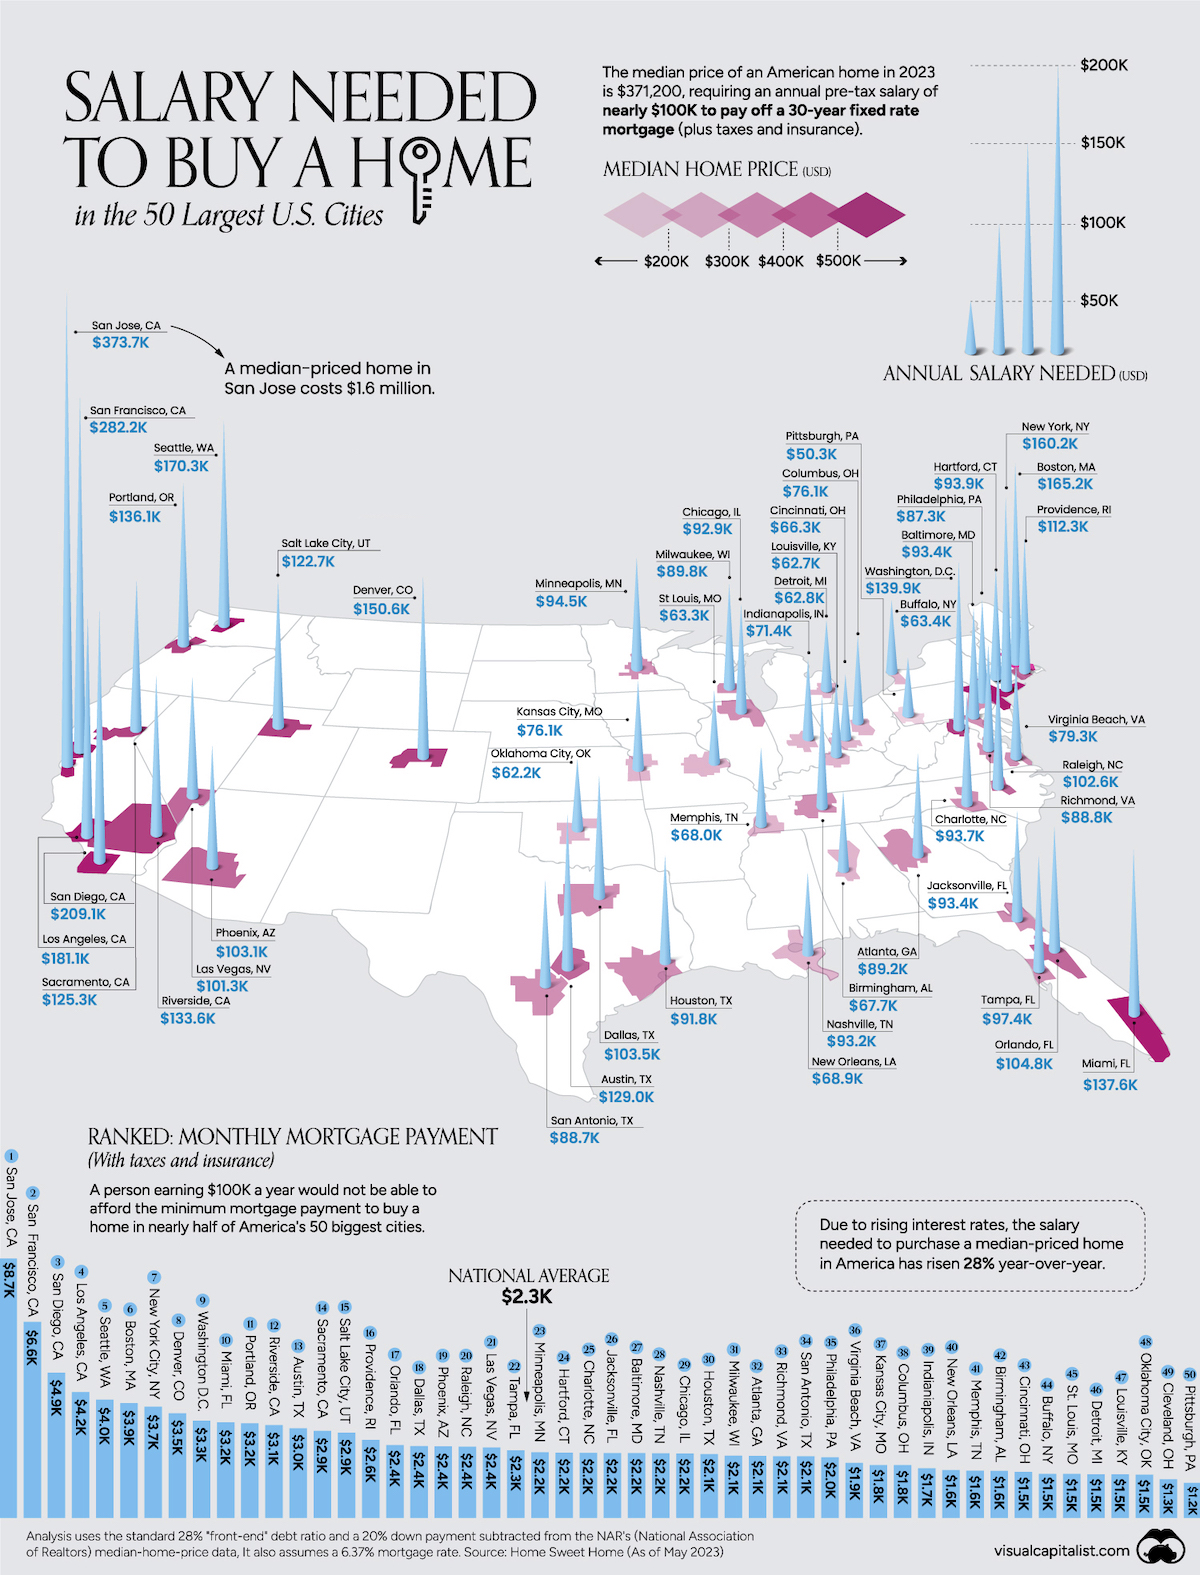
What You Need to Earn to Own a Home in 50 American Cities
Once a fundamental part of the American dream, the ability to own a home is drifting farther and farther away for many Americans.
Between skyrocketing prices, stagnating wages, and now rising interest rates, the deck seems to be increasingly stacked against home ownership.
Using May 2023 data tabulated by Home Sweet Home, we map out the annual salary needed to afford a 30-year mortgage (at 6.37%) to buy a home in America’s 50 most populous metropolitan areas.
The monthly minimum mortgage payment includes taxes and insurance as well, and is capped at roughly one-third of the income. This analysis also assumes that the homeowner will put down a 20% down payment.
The Least and Most Affordable American Cities to Own a Home
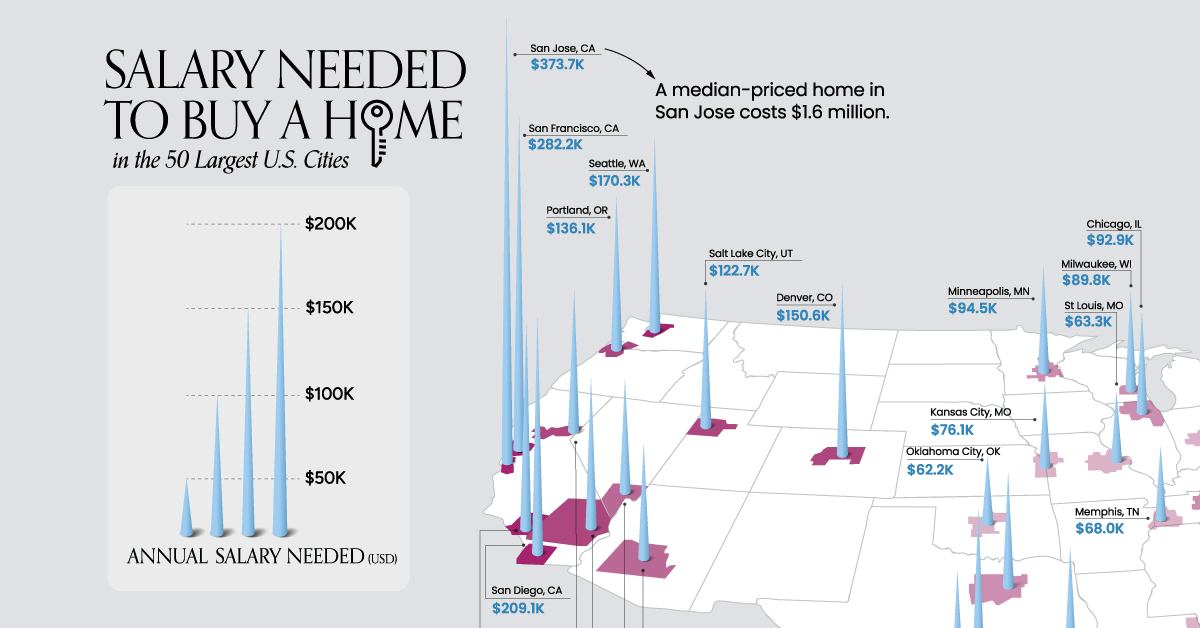
At the top of the list, and at the very west of the country, San Jose is the least affordable city to own a home for the average American.
One would have to earn at least $374,000 a year to afford a $1.6 million dollar home in the city.
To put those numbers into perspective, the median American annual income is $75,000, about one-fifth what’s required to buy a home in San Jose.
Here’s a look at the annual earnings needed to afford a home in all 50 largest cities in the U.S., ranked from least to most affordable.
| Rank | Metro Area | State | Median Home Price | Annual Salary |
|---|---|---|---|---|
| 1 | San Jose | California | $1,618,400 | $373,696 |
| 2 | San Francisco | California | $1,192,600 | $282,167 |
| 3 | San Diego | California | $880,000 | $209,110 |
| 4 | Los Angeles | California | $746,800 | $181,106 |
| 5 | Seattle | Washington | $699,300 | $170,340 |
| 6 | Boston | Massachusetts | $644,400 | $165,239 |
| 7 | New York City | New York | $577,300 | $160,233 |
| 8 | Denver | Colorado | $636,100 | $150,622 |
| 9 | Washington, D.C. | N/A | $557,200 | $139,911 |
| 10 | Miami | Florida | $560,000 | $137,574 |
| 11 | Portland | Oregon | $556,800 | $136,147 |
| 12 | Riverside/San Bernardino | California | $550,000 | $133,607 |
| 13 | Austin | Texas | $467,900 | $128,995 |
| 14 | Sacramento | California | $500,000 | $125,304 |
| 15 | Salt Lake City | Utah | $522,700 | $122,717 |
| 16 | Providence | Rhode Island | $417,000 | $112,281 |
| 17 | Orlando | Florida | $419,900 | $104,772 |
| 18 | Dallas | Texas | $372,400 | $103,460 |
| 19 | Phoenix | Arizona | $439,700 | $103,112 |
| 20 | Raleigh | North Carolina | $420,000 | $102,572 |
| 21 | Las Vegas | Nevada | $431,400 | $101,310 |
| 22 | Tampa | Florida | $390,000 | $97,387 |
| 23 | Minneapolis | Michigan | $361,500 | $94,466 |
| 24 | Hartford | Connecticut | $314,900 | $93,861 |
| 25 | Charlotte | North Carolina | $387,200 | $93,735 |
| 26 | Jacksonville | Florida | $370,000 | $93,422 |
| 27 | Baltimore | Maryland | $357,800 | $93,378 |
| 28 | Nashville | Tennessee | $385,800 | $93,168 |
| 29 | Chicago | Illinois | $321,000 | $92,868 |
| 30 | Houston | Texas | $327,000 | $91,826 |
| 31 | Milwaukee | Wisconsin | $339,600 | $89,752 |
| 32 | Atlanta | Georgia | $354,300 | $89,198 |
| 33 | Richmond | Virginia | $362,300 | $88,769 |
| 34 | San Antonio | Texas | $320,500 | $88,683 |
| 35 | Philadelphia | Pennsylvania | $315,300 | $87,293 |
| 36 | Virginia Beach | Virginia | $313,200 | $79,336 |
| 37 | Kansas City | Missouri | $291,000 | $76,147 |
| 38 | Columbus | Ohio | $284,700 | $76,133 |
| 39 | Indianapolis | Indiana | $289,300 | $71,409 |
| 40 | New Orleans | Louisiana | $265,200 | $68,946 |
| 41 | Memphis | Tennessee | $268,600 | $68,005 |
| 42 | Birmingham | Alabama | $276,500 | $67,773 |
| 43 | Cincinnati | Ohio | $252,200 | $66,260 |
| 44 | Buffalo | New York | $206,800 | $63,386 |
| 45 | St Louis | Missouri | $231,100 | $63,260 |
| 46 | Detroit | Michigan | $227,000 | $62,758 |
| 47 | Louisville | Kentucky | $246,000 | $62,741 |
| 48 | Oklahoma City | Oklahoma | $227,300 | $62,161 |
| 49 | Cleveland | Ohio | $191,400 | $55,515 |
| 50 | Pittsburgh | Pennsylvania | $175,000 | $50,316 |
| National | $371,200 | $97,204 |
Other Californian cities, San Francisco (ranked 2nd), San Diego (3rd), and Los Angeles (4th) all require an annual income of at least $180,000 to attempt home ownership within their metropolitan boundaries.
Boston (ranked 6th) and New York (ranked 7th) represent unaffordability on the East Coast, both requiring at least $160,000 a year to buy homes there.
It’s not just the coasts that are expensive however. To buy a home in Denver (ranked 8th) and Salt Lake City (15th) means earning more than $120,000 a year.
However, cities in the Midwest and South, like Pittsburgh, Detroit, Oklahoma City, and Louisville, are far more affordable, requiring less than $63,000 a year to buy a home.
Interest Rates Rock Home Ownership Chances
Aside from the obvious price differences in housing markets, a key factor that has elevated income requirements across the board is the rapid rise in interest rates in the last year. In fact the average 30-year mortgage has pushed past 7%, the highest it’s been since the 2000s.
This means that while the median price of a house in San Jose has actually come down between 2022 and 2023, the minimum monthly payment has increased from $7,717 to $8,720 this year.
| Rank | Metro Area | State | Median Home Price | Monthly Payment |
|---|---|---|---|---|
| 1 | San Jose | California | $1,618,400 | $8,720 |
| 2 | San Francisco | California | $1,192,600 | $6,584 |
| 3 | San Diego | California | $880,000 | $4,879 |
| 4 | Los Angeles | California | $746,800 | $4,226 |
| 5 | Seattle | Washington | $699,300 | $3,975 |
| 6 | Boston | Massachusetts | $644,400 | $3,856 |
| 7 | New York City | New York | $577,300 | $3,739 |
| 8 | Denver | Colorado | $636,100 | $3,515 |
| 9 | Washington, D.C. | N/A | $557,200 | $3,265 |
| 10 | Miami | Florida | $560,000 | $3,210 |
| 11 | Portland | Oregon | $556,800 | $3,177 |
| 12 | Riverside/San Bernardino | California | $550,000 | $3,118 |
| 13 | Austin | Texas | $467,900 | $3,010 |
| 14 | Sacramento | California | $500,000 | $2,924 |
| 15 | Salt Lake City | Utah | $522,700 | $2,863 |
| 16 | Providence | Rhode Island | $417,000 | $2,620 |
| 17 | Orlando | Florida | $419,900 | $2,445 |
| 18 | Dallas | Texas | $372,400 | $2,414 |
| 19 | Phoenix | Arizona | $439,700 | $2,406 |
| 20 | Raleigh | North Carolina | $420,000 | $2,393 |
| 21 | Las Vegas | Nevada | $431,400 | $2,364 |
| 22 | Tampa | Florida | $390,000 | $2,272 |
| 23 | Minneapolis | Michigan | $361,500 | $2,204 |
| 24 | Hartford | Connecticut | $314,900 | $2,190 |
| 25 | Charlotte | North Carolina | $387,200 | $2,187 |
| 26 | Jacksonville | Florida | $370,000 | $2,180 |
| 27 | Baltimore | Maryland | $357,800 | $2,179 |
| 28 | Nashville | Tennessee | $385,800 | $2,174 |
| 29 | Chicago | Illinois | $321,000 | $2,167 |
| 30 | Houston | Texas | $327,000 | $2,143 |
| 31 | Milwaukee | Wisconsin | $339,600 | $2,094 |
| 32 | Atlanta | Georgia | $354,300 | $2,081 |
| 33 | Richmond | Virginia | $362,300 | $2,071 |
| 34 | San Antonio | Texas | $320,500 | $2,069 |
| 35 | Philadelphia | Pennsylvania | $315,300 | $2,037 |
| 36 | Virginia Beach | Virginia | $313,200 | $1,851 |
| 37 | Kansas City | Missouri | $291,000 | $1,777 |
| 38 | Columbus | Ohio | $284,700 | $1,776 |
| 39 | Indianapolis | Indiana | $289,300 | $1,666 |
| 40 | New Orleans | Louisiana | $265,200 | $1,609 |
| 41 | Memphis | Tennessee | $268,600 | $1,587 |
| 42 | Birmingham | Alabama | $276,500 | $1,581 |
| 43 | Cincinnati | Ohio | $252,200 | $1,546 |
| 44 | Buffalo | New York | $206,800 | $1,479 |
| 45 | St Louis | Missouri | $231,100 | $1,476 |
| 46 | Detroit | Michigan | $227,000 | $1,464 |
| 47 | Louisville | Kentucky | $246,000 | $1,464 |
| 48 | Oklahoma City | Oklahoma | $227,300 | $1,450 |
| 49 | Cleveland | Ohio | $191,400 | $1,295 |
| 50 | Pittsburgh | Pennsylvania | $175,000 | $1,174 |
| National | $371,200 | $2,268 |
So to afford a median-priced home in the country, an American needs to earn closer to $100,000 a year, up from $75,500 in 2022. And even then, they would be priced out of owning a home in nearly half of the 50 largest cities in the country.
As a result Americans may yet further delay home ownership. Renting is now a far more attractive option, thanks to the biggest difference between rent and mortgages in over 50 years.
Where Does This Data Come From?
Source: Home Sweet Home (HSH).
Note: HSH used different sources for their median home prices, mortgage rate, property taxes and home insurance figures for their analysis. Please visit their website for more information.
Other: If other personal debts exceed 8% of one’s given monthly gross income, this may increase the salary needed to qualify for a mortgage.


Personal Finance
Visualizing the Tax Burden of Every U.S. State
Tax burden measures the percent of an individual’s income that is paid towards taxes. See where it’s the highest by state in this graphic.


Visualizing the Tax Burden of Every U.S. State
This was originally posted on our Voronoi app. Download the app for free on iOS or Android and discover incredible data-driven charts from a variety of trusted sources.
This map graphic visualizes the total tax burden in each U.S. state as of March 2024, based on figures compiled by WalletHub.
It’s important to understand that under this methodology, the tax burden measures the percent of an average person’s income that is paid towards state and local taxes. It considers property taxes, income taxes, and sales & excise tax.
Data and Methodology
The figures we used to create this graphic are listed in the table below.
| State | Total Tax Burden |
|---|---|
| New York | 12.0% |
| Hawaii | 11.8% |
| Vermont | 11.1% |
| Maine | 10.7% |
| California | 10.4% |
| Connecticut | 10.1% |
| Minnesota | 10.0% |
| Illinois | 9.7% |
| New Jersey | 9.5% |
| Rhode Island | 9.4% |
| Utah | 9.4% |
| Kansas | 9.3% |
| Maryland | 9.3% |
| Iowa | 9.2% |
| Nebraska | 9.2% |
| Ohio | 8.9% |
| Indiana | 8.9% |
| Arkansas | 8.8% |
| Mississippi | 8.8% |
| Massachusetts | 8.6% |
| Virginia | 8.5% |
| West Virginia | 8.5% |
| Oregon | 8.4% |
| Colorado | 8.4% |
| Pennsylvania | 8.4% |
| Wisconsin | 8.3% |
| Louisiana | 8.3% |
| Kentucky | 8.3% |
| Washington | 8.0% |
| New Mexico | 8.0% |
| Michigan | 8.0% |
| North Carolina | 7.9% |
| Idaho | 7.9% |
| Arizona | 7.8% |
| Missouri | 7.8% |
| Georgia | 7.7% |
| Texas | 7.6% |
| Alabama | 7.5% |
| Montana | 7.5% |
| South Carolina | 7.5% |
| Nevada | 7.4% |
| Oklahoma | 7.0% |
| North Dakota | 6.8% |
| South Dakota | 6.4% |
| Delaware | 6.4% |
| Tennessee | 6.1% |
| Florida | 6.1% |
| Wyoming | 5.7% |
| New Hampshire | 5.6% |
| Alaska | 4.9% |
From this data we can see that New York has the highest total tax burden. Residents in this state will pay, on average, 12% of their income to state and local governments.
Breaking this down into its three components, the average New Yorker pays 4.6% of their income on income taxes, 4.4% on property taxes, and 3% in sales & excise taxes.
At the other end of the spectrum, Alaska has the lowest tax burden of any state, equaling 4.9% of income. This is partly due to the fact that Alaskans do not pay state income tax.
Hate Paying Taxes?
In addition to Alaska, there are several other U.S. states that don’t charge income taxes. These are: Florida, Nevada, South Dakota, Tennessee, Texas, Washington, and Wyoming.
It’s also worth noting that New Hampshire does not have a regular income tax, but does charge a flat 4% on interest and dividend income according to the Tax Foundation.
Learn More About Taxation From Visual Capitalist
If you enjoyed this post, be sure to check out this graphic which ranks the countries with the lowest corporate tax rates, from 1980 to today.

-

 Mining1 week ago
Where the World’s Aluminum is Smelted, by Country
-

 Culture6 days ago
How Popular Snack Brand Logos Have Changed
-

 Mining7 days ago
Visualizing Copper Production by Country in 2023
-

 Politics1 week ago
Charted: How Americans Feel About Federal Government Agencies
-

 Healthcare1 week ago
Which Countries Have the Highest Infant Mortality Rates?
-

 Demographics1 week ago
Mapped: U.S. Immigrants by Region
-

 Economy1 week ago
Mapped: Southeast Asia’s GDP Per Capita, by Country
-

 Automotive1 week ago
How People Get Around in America, Europe, and Asia