Technology
Visualizing the Top U.S. States for AI Jobs


Visualizing the Top U.S. States for AI Jobs
Much ink has been spilled over fears that artificial intelligence (AI) will eliminate jobs in the economy. While some of those fears may be well-founded, red-hot interest in AI innovation is creating new jobs as well.
This graphic visualizes data from Lightcast, a labor market analytics firm, which shows how many AI-related jobs were posted in each state throughout 2022.
In total there were 795,624 AI jobs posted throughout the year, of which 469,925 (59%) were in the top 10. The full tally is included in the table below.
| Rank | State | Number of job postings | % of total |
|---|---|---|---|
| 1 | California | 142,154 | 17.9% |
| 2 | Texas | 66,624 | 8.4% |
| 3 | New York | 43,899 | 5.5% |
| 4 | Massachusetts | 34,603 | 4.3% |
| 5 | Virginia | 34,221 | 4.3% |
| 6 | Florida | 33,585 | 4.2% |
| 7 | Illinois | 31,569 | 4.0% |
| 8 | Washington | 31,284 | 3.9% |
| 9 | Georgia | 26,620 | 3.3% |
| 10 | Michigan | 25,366 | 3.2% |
| 11 | North Carolina | 23,854 | 3.0% |
| 12 | New Jersey | 23,447 | 2.9% |
| 13 | Colorado | 20,421 | 2.6% |
| 14 | Pennsylvania | 20,397 | 2.6% |
| 15 | Arizona | 19,514 | 2.5% |
| 16 | Ohio | 19,208 | 2.4% |
| 17 | Maryland | 16,769 | 2.1% |
| 18 | Minnesota | 11,808 | 1.5% |
| 19 | Tennessee | 11,173 | 1.4% |
| 20 | Missouri | 10,990 | 1.4% |
| 21 | Oregon | 10,811 | 1.4% |
| 22 | Washington, D.C. | 9,606 | 1.2% |
| 23 | Indiana | 9,247 | 1.2% |
| 24 | Connecticut | 8,960 | 1.1% |
| 25 | Wisconsin | 8,879 | 1.1% |
| 26 | Alabama | 7,866 | 1.0% |
| 27 | Kansas | 7,683 | 1.0% |
| 28 | Arkansas | 7,247 | 0.9% |
| 29 | Utah | 6,885 | 0.9% |
| 30 | Nevada | 6,813 | 0.9% |
| 31 | Idaho | 6,109 | 0.8% |
| 32 | Oklahoma | 5,719 | 0.7% |
| 33 | Iowa | 5,670 | 0.7% |
| 34 | South Carolina | 4,928 | 0.6% |
| 35 | Louisiana | 4,806 | 0.6% |
| 36 | Kentucky | 4,536 | 0.6% |
| 37 | Nebraska | 4,032 | 0.5% |
| 38 | Delaware | 3,503 | 0.4% |
| 39 | New Mexico | 3,357 | 0.4% |
| 40 | Rhode Island | 2,965 | 0.4% |
| 41 | New Hampshire | 2,719 | 0.3% |
| 42 | Hawaii | 2,550 | 0.3% |
| 43 | Mississippi | 2,548 | 0.3% |
| 44 | Maine | 2,227 | 0.3% |
| 45 | South Dakota | 2,195 | 0.3% |
| 46 | Vermont | 1,571 | 0.2% |
| 47 | North Dakota | 1,227 | 0.2% |
| 48 | Alaska | 970 | 0.1% |
| 49 | West Virginia | 887 | 0.1% |
| 50 | Montana | 833 | 0.1% |
| 51 | Wyoming | 769 | 0.1% |
The following chart adds some context to these numbers. It shows how the percentage of AI job postings in some of the top states has changed since 2010.
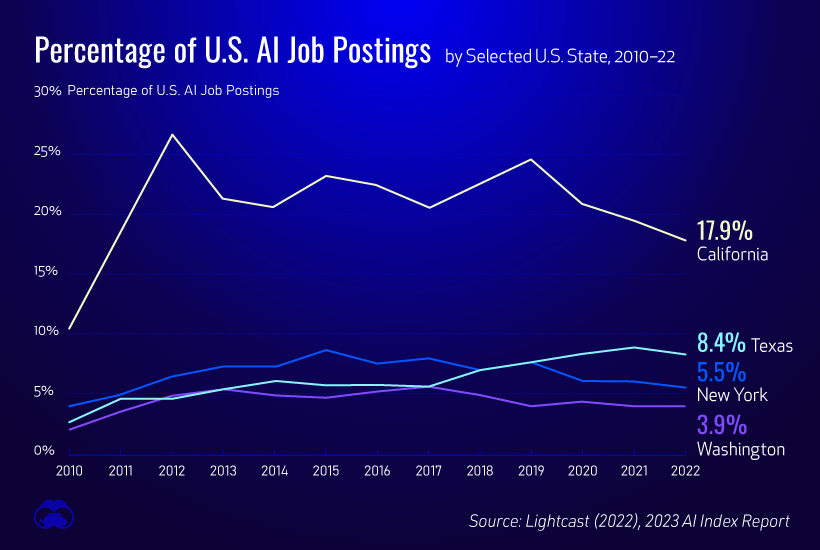
We can see that California quickly became the primary destination for AI jobs in the early 2010s, presumably as Silicon Valley companies began developing the technology.
California’s share has since declined, with a significant number of jobs seemingly moving to Texas. In fact, many tech companies are relocating to Texas to avoid California’s relatively higher taxes and cost of living.
The 10 Most In-Demand Specialized Skills
Lightcast also captured the top 10 specialized skills that were required for AI-related jobs. These are listed in the table below.
| Skill | Frequency (number of postings) | Frequency (% of postings) |
|---|---|---|
| Python | 296,662 | 37% |
| Computer Science | 260,333 | 33% |
| SQL | 185,807 | 23% |
| Data Analysis | 159,801 | 20% |
| Data Science | 157,855 | 20% |
| Amazon Web Services | 155,615 | 19% |
| Agile Methodology | 152,965 | 19% |
| Automation | 138,791 | 17% |
| Java | 133,856 | 17% |
| Software Engineering | 133,286 | 17% |
If you’re interested in a career that focuses on AI, becoming proficient in Python is likely to be a good first step.


Technology
Countries With the Highest Rates of Crypto Ownership
While the U.S. is a major market for cryptocurrencies, two countries surpass it in terms of their rates of crypto ownership.


Countries With the Highest Rates of Crypto Ownership
This was originally posted on our Voronoi app. Download the app for free on iOS or Android and discover incredible data-driven charts from a variety of trusted sources.
This graphic ranks the top 10 countries by their rate of cryptocurrency ownership, which is the percentage of the population that owns crypto. These figures come from crypto payment gateway, Triple-A, and are as of 2023.
Data and Highlights
The table below lists the rates of crypto ownership in the top 10 countries, as well as the number of people this amounts to.
| Country | % of Population Who Own Crypto | # of Crypto Owners |
|---|---|---|
| 🇦🇪 United Arab Emirates | 30.4 | 3M |
| 🇻🇳 Vietnam | 21.2 | 21M |
| 🇺🇸 U.S. | 15.6 | 53M |
| 🇮🇷 Iran | 13.5 | 12M |
| 🇵🇭 Philippines | 13.4 | 16M |
| 🇧🇷 Brazil | 12 | 26M |
| 🇸🇦 Saudi Arabia | 11.4 | 4M |
| 🇸🇬 Singapore | 11.1 | 665K |
| 🇺🇦 Ukraine | 10.6 | 4M |
| 🇻🇪 Venezuela | 10.3 | 3M |
Note that if we were to rank countries based on their actual number of crypto owners, India would rank first at 93 million people, China would rank second at 59 million people, and the U.S. would rank third at 52 million people.
The UAE Takes the Top Spot
The United Arab Emirates (UAE) boasts the highest rates of crypto ownership globally. The country’s government is considered to be very crypto friendly, as described in Henley & Partners’ Crypto Wealth Report 2023:
In the UAE, the Financial Services Regulatory Authority (FSRA-ADGM) was the first to provide rules and regulations regarding cryptocurrency purchasing and selling. The Emirates are generally very open to new technologies and have proposed zero taxes for crypto owners and businesses.
Vietnam leads Southeast Asia
According to the Crypto Council for Innovation, cryptocurrency holdings in Vietnam are also untaxed, making them an attractive asset.
Another reason for Vietnam’s high rates of ownership could be its large unbanked population (people without access to financial services). Cryptocurrencies may provide an alternative means of accessing these services without relying on traditional banks.
Learn More About Crypto From Visual Capitalist
If you enjoyed this post, be sure to check out The World’s Largest Corporate Holders of Bitcoin, which ranks the top 12 publicly traded companies by their Bitcoin holdings.

-

 Markets6 days ago
Mapped: Europe’s GDP Per Capita, by Country
-

 Energy2 weeks ago
Mapped: The Age of Energy Projects in Interconnection Queues, by State
-

 Mining2 weeks ago
Visualizing Global Gold Production in 2023
-

 Markets2 weeks ago
Visualized: Interest Rate Forecasts for Advanced Economies
-

 Economy2 weeks ago
The Most Valuable Companies in Major EU Economies
-

 Markets1 week ago
The World’s Fastest Growing Emerging Markets (2024-2029 Forecast)
-

 Markets1 week ago
Visualizing Global Inflation Forecasts (2024-2026)
-

 United States1 week ago
Charted: What Southeast Asia Thinks About China & the U.S.