Markets
The Top 50 Largest Importers in the World
The Top 50 Largest Importers in the World
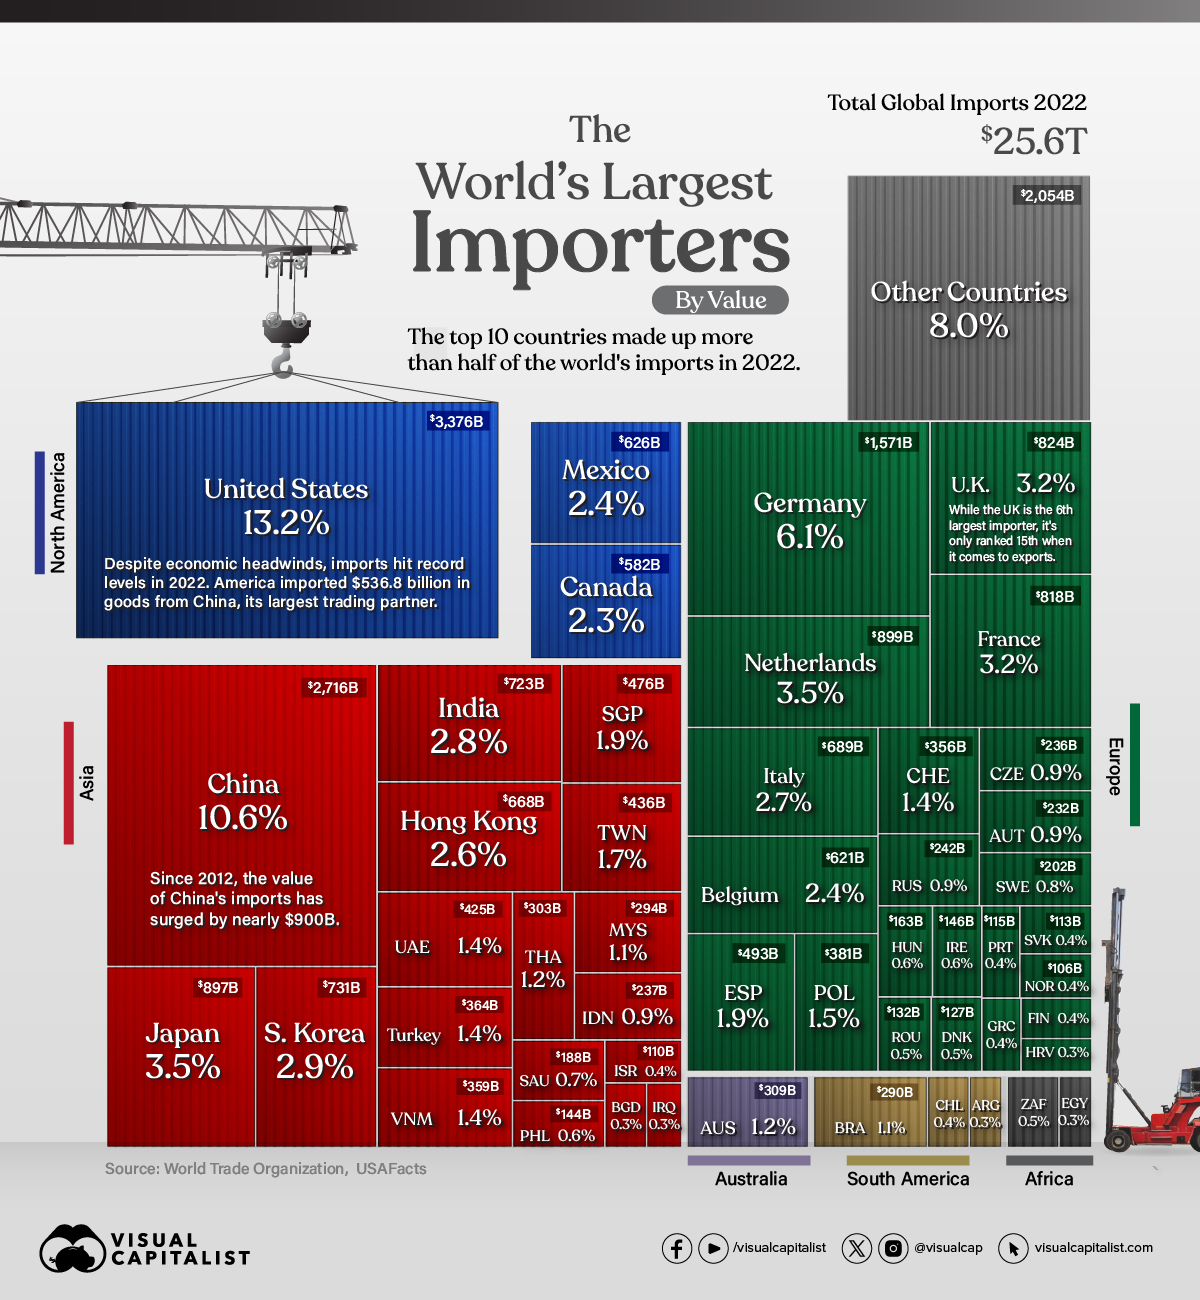
In 2022, global imports climbed to $25.6 trillion in value, or about the size of the U.S. GDP.
As an engine of growth, global trade broadens consumer choices and can lower the cost of goods. For businesses, it can improve the quality of inputs and strengthen competitiveness.
This graphic shows the 50 largest importers, with data from the World Trade Organization.
Which Countries Import the Most Goods?
With $3.4 trillion in imports in 2022, the U.S. is the largest importer globally.
Even though higher inflation and market uncertainty loomed over the economy, U.S. imports increased 15% annually, with China as its top goods importing partner.
| Country | Value 2022 | Share | Annual % Change |
|---|---|---|---|
| 🇺🇸 U.S. | $3,376B | 13.2% | 15.0% |
| 🇨🇳 China | $2,716B | 10.6% | 1.0% |
| 🇩🇪 Germany | $1,571B | 6.1% | 11.0% |
| 🇳🇱 Netherlands | $899B | 3.5% | 19.0% |
| 🇯🇵 Japan | $897B | 3.5% | 17.0% |
| 🇬🇧 UK | $824B | 3.2% | 19.0% |
| 🇫🇷 France | $818B | 3.2% | 14.0% |
| 🇰🇷 South Korea | $731B | 2.9% | 19.0% |
| 🇮🇳 India | $723B | 2.8% | 26.0% |
| 🇮🇹 Italy | $689B | 2.7% | 22.0% |
| 🇭🇰 Hong Kong SAR | $668B | 2.6% | -6.0% |
| 🇲🇽 Mexico | $626B | 2.4% | 20.0% |
| 🇧🇪 Belgium | $621B | 2.4% | 18.0% |
| 🇨🇦 Canada | $582B | 2.3% | 15.0% |
| 🇪🇸 Spain | $493B | 1.9% | 18.0% |
| 🇸🇬 Singapore | $476B | 1.9% | 17.0% |
| 🇹🇼 Taiwan | $436B | 1.7% | 14.0% |
| 🇦🇪 UAE | $425B | 1.4% | 12.0% |
| 🇵🇱 Poland | $381B | 1.5% | 11.0% |
| 🇹🇷 Turkey | $364B | 1.4% | 34.0% |
| 🇻🇳 Viet Nam | $359B | 1.4% | 8.0% |
| 🇨🇭 Switzerland | $356B | 1.4% | 10.0% |
| 🇦🇺 Australia | $309B | 1.2% | 18.0% |
| 🇹🇭 Thailand | $303B | 1.2% | 14.0% |
| 🇲🇾 Malaysia | $294B | 1.1% | 24.0% |
| 🇧🇷 Brazil | $290B | 1.1% | 25.0% |
| 🇷🇺 Russia | $242B | 0.9% | -21.0% |
| 🇮🇩 Indonesia | $237B | 0.9% | 21.0% |
| 🇨🇿 Czech Republic | $236B | 0.9% | 11.0% |
| 🇦🇹 Austria | $232B | 0.9% | 6.0% |
| 🇸🇪 Sweden | $202B | 0.8% | 8.0% |
| 🇸🇦 Saudi Arabia | $188B | 0.7% | 23.0% |
| 🇭🇺 Hungary | $163B | 0.6% | 14.0% |
| 🇮🇪 Ireland | $146B | 0.6% | 21.0% |
| 🇵🇭 Philippines | $144B | 0.6% | 26.0% |
| 🇿🇦 South Africa | $136B | 0.5% | 19.0% |
| 🇷🇴 Romania | $132B | 0.5% | 14.0% |
| 🇩🇰 Denmark | $127B | 0.5% | 5.0% |
| 🇵🇹 Portugal | $115B | 0.4% | 17.0% |
| 🇸🇰 Slovak Republic | $113B | 0.4% | 9.0% |
| 🇮🇱 Israel | $110B | 0.4% | 16.0% |
| 🇳🇴 Norway | $106B | 0.4% | 8.0% |
| 🇨🇱 Chile | $104B | 0.4% | 13.0% |
| 🇬🇷 Greece | $98B | 0.4% | 27.0% |
| 🇫🇮 Finland | $97B | 0.4% | 13.0% |
| 🇧🇩 Bangladesh | $89B | 0.3% | 10.0% |
| 🇪🇬 Egypt | $86B | 0.3% | 27.0% |
| 🇦🇷 Argentina | $82B | 0.3% | 19.0% |
| 🇮🇶 Iraq | $78B | 0.3% | 18.0% |
| 🇭🇷 Croatia | $77B | 0.3% | 27.0% |
| Rest of World | $2,054B | 8.0% | |
| 🌎 World | $25,621B | 100.0% | 13.0% |
As the world’s second-largest economy, China’s imports hit $2.7 trillion in value, although growth slowed in 2022.
Taiwan, China’s top trading partner for imports, is a major provider of electronics products, including semiconductor chips. However, the China-Taiwan trade relationship remains complicated given geopolitical tensions sparking unexpected import bans.
A handful of European countries also fell in the top 10 importers, led by Germany and the Netherlands. Overall, the European Union is the largest importer of agricultural products, fuels and mining products, and automotive products globally.
Global Trade Fragmentation
In 2023, the World Trade Organization projects that import volumes will contract as much as 1.2% across North and South America, Asia, and Europe.
In part, this is being driven by slower demand in manufacturing economies.
Whether or not this weaker volume is also being impacted by trade fragmentation remains unclear. One indicator may be seen in the trade of intermediate goods, which are products like wood and steel that are used in the production of a final good.
In the first half of 2023, the share of intermediate goods in world trade dropped to 48.5%, down from its three-year average of 51%. On the one hand, this may suggest that supply chains are contracting. Yet it may also be due to the influence of higher commodity prices, which have a bigger impact on the cost of intermediate goods than on final goods.
Still, other factors have an impact on the flow of trade. These include subsidies, export bans, and legislative policy, such as the $52.7 billion U.S. CHIPS Act, that incentivizes local production of semiconductors.
Considering these factors, broader trends of global de-globalization remain to be seen.


Maps
Mapped: The 10 U.S. States With the Lowest Real GDP Growth
In this graphic, we show where real GDP lagged the most across America in 2023 as high interest rates weighed on state economies.


The Top 10 U.S. States, by Lowest Real GDP Growth
This was originally posted on our Voronoi app. Download the app for free on iOS or Android and discover incredible data-driven charts from a variety of trusted sources.
While the U.S. economy defied expectations in 2023, posting 2.5% in real GDP growth, several states lagged behind.
Last year, oil-producing states led the pack in terms of real GDP growth across America, while the lowest growth was seen in states that were more sensitive to the impact of high interest rates, particularly due to slowdowns in the manufacturing and finance sectors.
This graphic shows the 10 states with the least robust real GDP growth in 2023, based on data from the Bureau of Economic Analysis.
Weakest State Economies in 2023
Below, we show the states with the slowest economic activity in inflation-adjusted terms, using chained 2017 dollars:
| Rank | State | Real GDP Growth 2023 YoY | Real GDP 2023 |
|---|---|---|---|
| 1 | Delaware | -1.2% | $74B |
| 2 | Wisconsin | +0.2% | $337B |
| 3 | New York | +0.7% | $1.8T |
| 4 | Missississippi | +0.7% | $115B |
| 5 | Georgia | +0.8% | $661B |
| 6 | Minnesota | +1.2% | $384B |
| 7 | New Hampshire | +1.2% | $91B |
| 8 | Ohio | +1.2% | $698B |
| 9 | Iowa | +1.3% | $200B |
| 10 | Illinois | +1.3% | $876B |
| U.S. | +2.5% | $22.4T |
Delaware witnessed the slowest growth in the country, with real GDP growth of -1.2% over the year as a sluggish finance and insurance sector dampened the state’s economy.
Like Delaware, the Midwestern state of Wisconsin also experienced declines across the finance and insurance sector, in addition to steep drops in the agriculture and manufacturing industries.
America’s third-biggest economy, New York, grew just 0.7% in 2023, falling far below the U.S. average. High interest rates took a toll on key sectors, with notable slowdowns in the construction and manufacturing sectors. In addition, falling home prices and a weaker job market contributed to slower economic growth.
Meanwhile, Georgia experienced the fifth-lowest real GDP growth rate. In March 2024, Rivian paused plans to build a $5 billion EV factory in Georgia, which was set to be one of the biggest economic development initiatives in the state in history.
These delays are likely to exacerbate setbacks for the state, however, both Kia and Hyundai have made significant investments in the EV industry, which could help boost Georgia’s manufacturing sector looking ahead.

-

 Personal Finance1 week ago
Visualizing the Tax Burden of Every U.S. State
-

 Misc6 days ago
Visualized: Aircraft Carriers by Country
-

 Culture6 days ago
How Popular Snack Brand Logos Have Changed
-

 Mining1 week ago
Visualizing Copper Production by Country in 2023
-

 Misc1 week ago
Charted: How Americans Feel About Federal Government Agencies
-

 Healthcare1 week ago
Which Countries Have the Highest Infant Mortality Rates?
-

 Demographics1 week ago
Mapped: U.S. Immigrants by Region
-

 Maps1 week ago
Mapped: Southeast Asia’s GDP Per Capita, by Country