Misc
Ranked: Median Student Debt for a U.S. College Degree
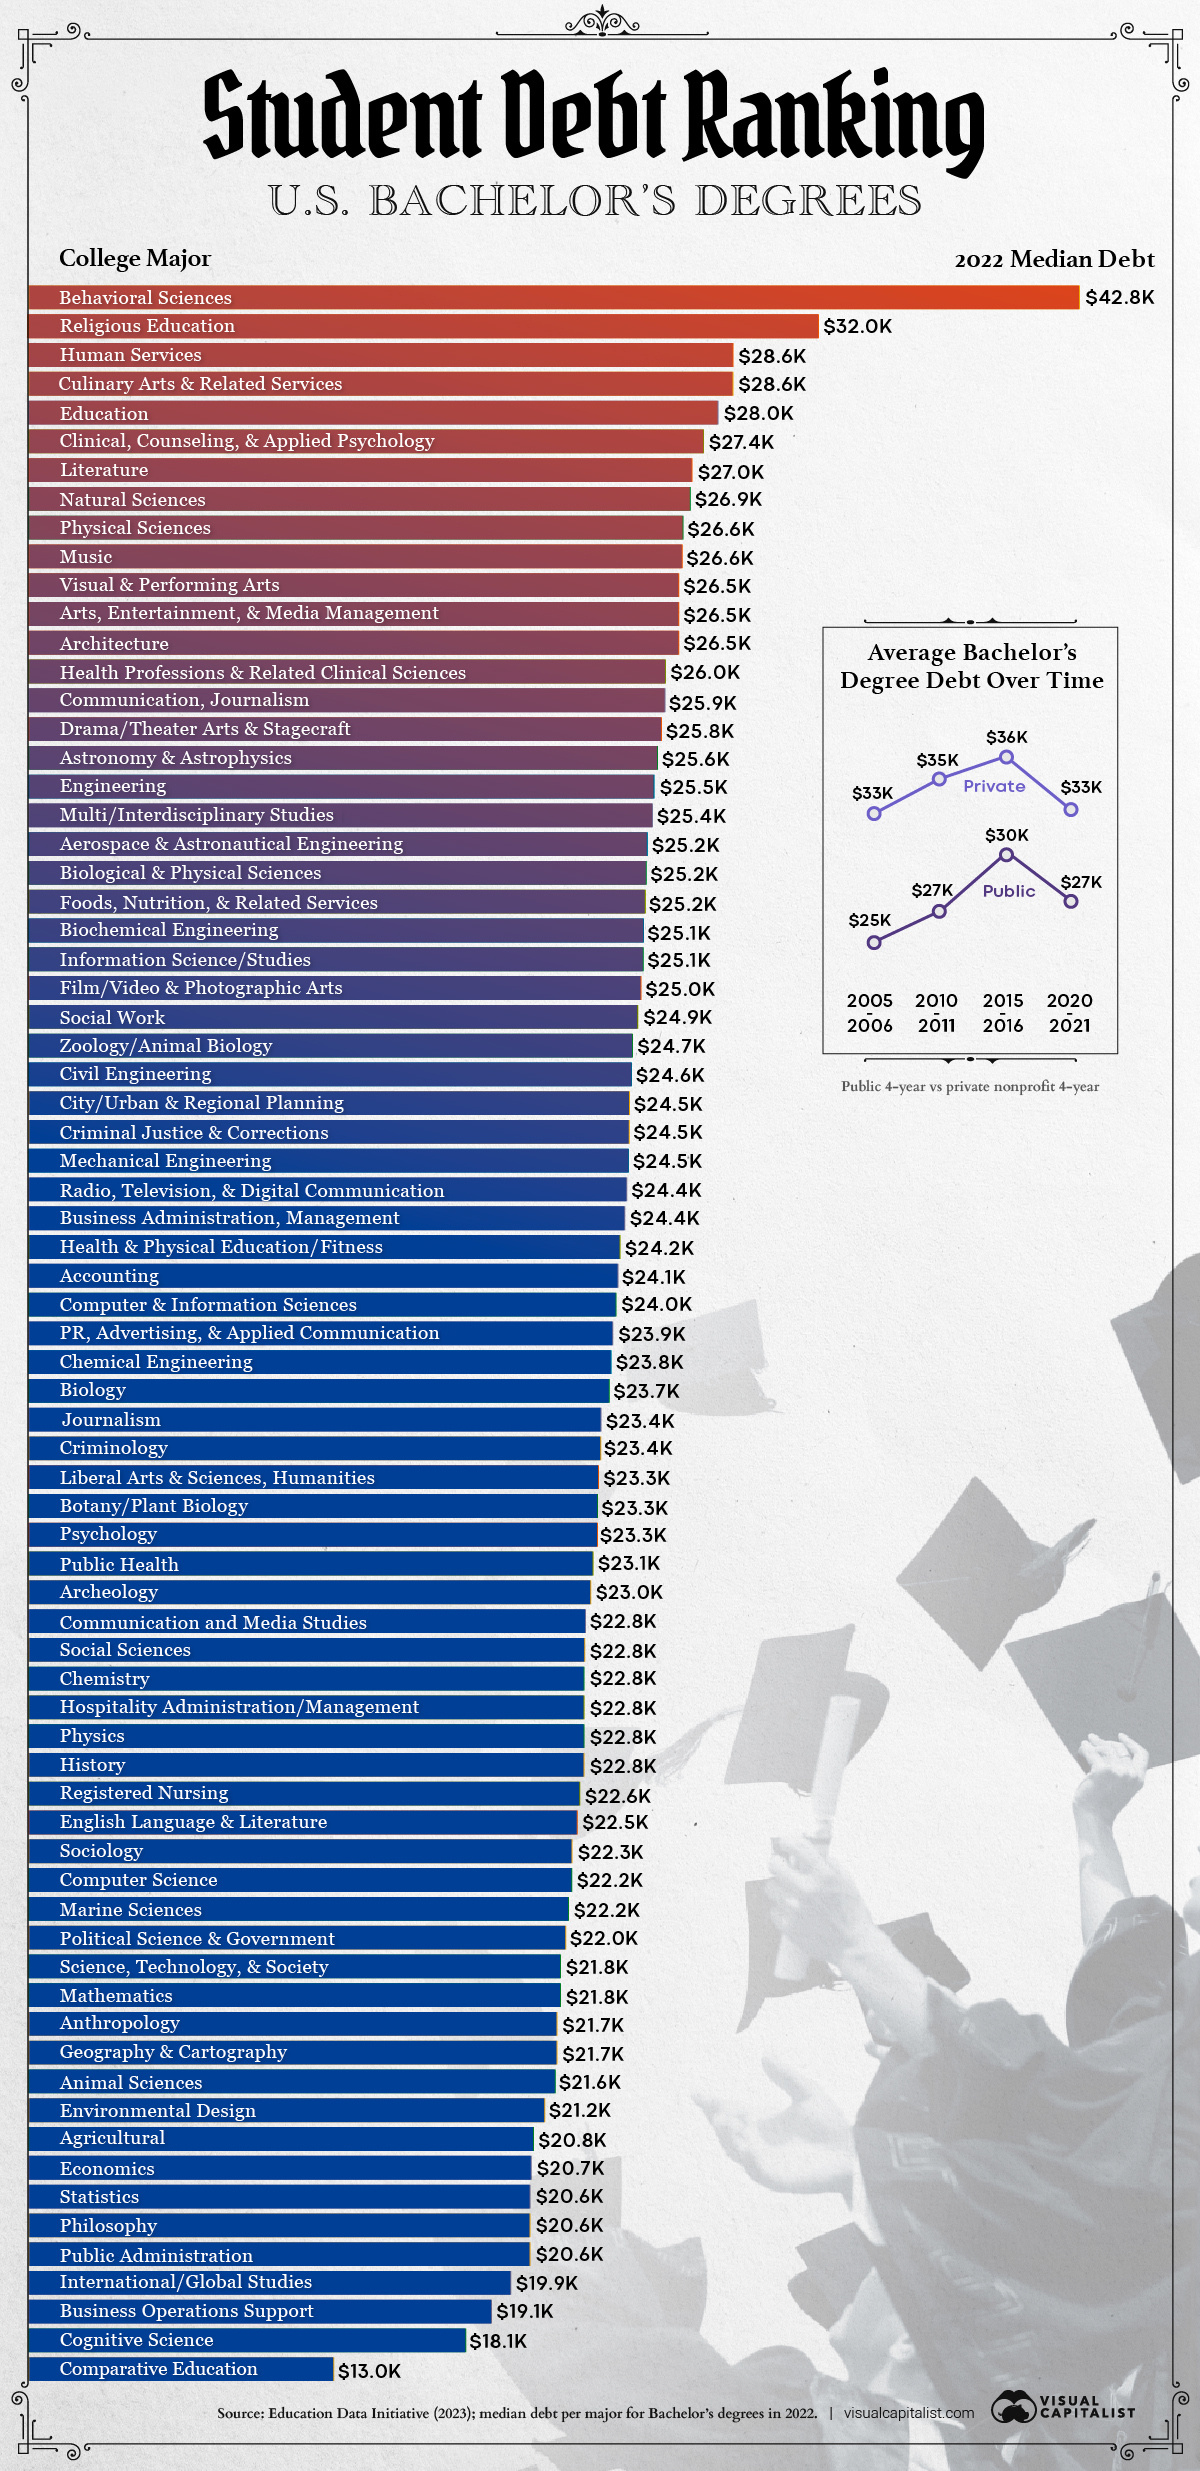
Student Debt Ranking: U.S. College Degrees
According to the Federal Reserve, student loans added up to $1.6 trillion in Q2 2023, making them the third largest category of U.S. household debt behind auto loans ($1.8 trillion) and mortgages ($12 trillion).
The current student debt figure represents a 40% increase from a decade ago, resulting in greater pressure for the federal government to do more to help debtors. For example, on Oct 4. 2023, the Biden administration announced an additional $9 billion in student debt cancellations, bringing the total relief amount to $127 billion.
With student debt becoming a broader social issue, we’ve visualized data from the Education Data Initiative to show you the median debt per major for a bachelor’s degree in the country.
Dataset and Highlights
The following table includes all of the data we used to create this graphic. Note that we’re showing median student debt, which differs from the mean average.
To understand how this works, imagine a list of every student’s debt for a given major. The median represents the middle value, meaning half of students owe less than that amount, while the other half owes more.
| Major | Field of Study | 2022 Median Debt (USD thousands) |
|---|---|---|
| Behavioral Sciences | Social Sciences | $42.8 |
| Religious Education | Arts and Humanities | $32.0 |
| Culinary Arts and Related Services | Arts and Humanities | $28.6 |
| Human Services | Social Sciences | $28.6 |
| Education | Other | $28.0 |
| Clinical, Counseling, and Applied Psychology | Health and Medicine | $27.4 |
| Literature | Arts and Humanities | $27.0 |
| Natural Sciences | Sciences | $26.9 |
| Physical Sciences | Sciences | $26.6 |
| Music | Arts and Humanities | $26.6 |
| Architecture | Arts and Humanities | $26.5 |
| Arts, Entertainment, and Media Management | Arts and Humanities | $26.5 |
| Visual and Performing Arts | Arts and Humanities | $26.5 |
| Health Professions and Related Clinical Sciences | Health and Medicine | $26.0 |
| Communication, Journalism, and Related Programs | Other | $25.9 |
| Drama/ Theater Arts and Stagecraft | Arts and Humanities | $25.8 |
| Astronomy and Astrophysics | Sciences | $25.6 |
| Engineering, General | Engineering | $25.5 |
| Multi-/Interdisciplinary Studies | Other | $25.4 |
| Aerospace, Aeronautical, and Astronautical Engineering | Engineering | $25.2 |
| Biological and Physical Sciences | Sciences | $25.2 |
| Foods, Nutrition, and Related Services | Health and Medicine | $25.2 |
| Biochemical Engineering | Engineering | $25.1 |
| Information Science/Studies | Sciences | $25.1 |
| Film/Video and Photographic Arts | Arts and Humanities | $25.0 |
| Social Work | Health and Medicine | $24.9 |
| Zoology/Animal Biology | Sciences | $24.7 |
| Civil Engineering | Engineering | $24.6 |
| City/Urban, Community, and Regional Planning | Social Sciences | $24.5 |
| Criminal Justice and Corrections | Social Sciences | $24.5 |
| Mechanical Engineering | Engineering | $24.5 |
| Radio, Television, and Digital Communication | Other | $24.4 |
| Business Administration, Management, and Operations | Other | $24.4 |
| Health and Physical Education/ Fitness | Health and Medicine | $24.2 |
| Accounting | Other | $24.1 |
| Computer & Information Sciences | Sciences | $24.0 |
| Public Relations, Advertising, and Applied Communication | Other | $23.9 |
| Chemical Engineering | Engineering | $23.8 |
| Biology | Sciences | $23.7 |
| Journalism | Other | $23.4 |
| Criminology | Social Sciences | $23.4 |
| Liberal Arts and Sciences, General Studies and Humanities | Social Sciences | $23.3 |
| Botany/Plant Biology | Sciences | $23.3 |
| Psychology | Social Sciences | $23.3 |
| Public Health | Health and Medicine | $23.1 |
| Archeology | Social Sciences | $23.0 |
| Communication and Media Studies | Other | $22.8 |
| Social Sciences | Social Sciences | $22.8 |
| Chemistry | Sciences | $22.8 |
| Hospitality Administration/Management | Health and Medicine | $22.8 |
| Physics | Sciences | $22.8 |
| History | Social Sciences | $22.8 |
| Registered Nursing, Nursing Administration, Nursing Research, and Clinical Nursing | Health and Medicine | $22.6 |
| English Language and Literature | Arts and Humanities | $22.5 |
| Sociology | Social Sciences | $22.3 |
| Computer Science | Sciences | $22.3 |
| Marine Sciences | Sciences | $22.2 |
| Political Science and Government | Social Sciences | $22.0 |
| Science, Technology, and Society | Sciences | $21.8 |
| Mathematics | Sciences | $21.8 |
| Geography and Cartography | Social Sciences | $21.7 |
| Anthropology | Social Sciences | $21.7 |
| Animal Sciences | Sciences | $21.6 |
| Environmental Design | Social Sciences | $21.2 |
| Agricultural | Sciences | $20.8 |
| Economics | Other | $20.7 |
| Statistics | Other | $20.6 |
| Public Administration | Social Sciences | $20.6 |
| Philosophy | Social Sciences | $20.6 |
| International/Global Studies | Other | $19.9 |
| Business Operations Support and Assistant Services | Other | $19.1 |
| Cognitive Science | Sciences | $18.1 |
| International and Comparative Education | Other | $13.0 |
From this dataset we can see that median debt for most Bachelor’s degrees is in the mid $20,000s range. Two outliers at the upper end are Behavioral Sciences ($42,800) and Religious Education ($32,000), while at the lower end we can see Comparative Education ($13,000) and Cognitive Science ($18,100).
Comparative education is a social science that involves the study of education systems, processes, and outcomes across different countries or cultures.
Looking at this data from a broader perspective, we can also see some trends emerge based on field of study. For starters, most Arts and Humanities degrees fall in the upper half of the ranking, while the bottom quarter of the ranking appears to be largely made up of Social Sciences, Sciences, and various business studies.
What About a Master’s Degree?
Education Data Initiative also includes median debt data for master’s degrees.
| Major | Field of Study | 2022 Median Debt (USD thousands) |
|---|---|---|
| Advanced/Graduate Dentistry and Oral Sciences | Health and Medicine | $158,155 |
| Visual and Performing Arts | Arts and Humanities | $63,830 |
| Radio, Television, and Digital Communication | Other | $55,554 |
| Social Sciences | Social Sciences | $54,554 |
| Philosophy | Social Sciences | $54,260 |
| Journalism | Other | $53,213 |
| Statistics | Other | $53,174 |
| Clinical, Counseling, and Applied Psychology | Health and Medicine | $51,888 |
| Registered Nursing, Nursing Administration, Nursing Research, and Clinical Nursing | Health and Medicine | $51,420 |
| Multi/Interdisciplinary Studies | Other | $48,693 |
| Public Relations, Advertising, and Applied Communication | Other | $48,366 |
| Sociology | Social Sciences | $46,871 |
| Health Professions and Related Clinical Sciences | Health and Medicine | $44,598 |
| English Language and Literature | Arts and Humanities | $44,301 |
| Political Science and Government | Social Sciences | $43,853 |
| Liberal Arts and Sciences, General Studies and Humanities | Social Sciences | $43,408 |
| Finance and Financial Management Services | Other | $43,408 |
| Psychology | Social Sciences | $43,408 |
| Business Administration, Management, and Operations | Other | $43,251 |
| Economics | Other | $43,053 |
| Literature | Arts and Humanities | $42,826 |
| Computer Engineering | Engineering | $42,647 |
| Public Administration | Social Sciences | $42,154 |
| Arts, Entertainment, and Media Management | Arts and Humanities | $41,238 |
| History | Social Sciences | $40,948 |
| Computer & Information Sciences | Sciences | $40,579 |
| Anthropology | Social Sciences | $40,428 |
| Biology | Sciences | $40,265 |
| Architecture | Arts and Humanities | $39,788 |
| Communication and Media Studies | Other | $39,270 |
| International/Global Studies | Other | $37,180 |
| Zoology/Animal Biology | Sciences | $37,056 |
| Hospitality Administration/Management | Other | $36,203 |
| Marketing | Other | $35,738 |
| Criminology | Social Sciences | $35,318 |
| Computer Science | Sciences | $35,301 |
| Engineering | Engineering | $33,235 |
| Health and Physical Education/Fitness | Health and Medicine | $32,372 |
| Agriculture | Sciences | $30,676 |
| Geography and Cartography | Social Sciences | $30,657 |
| Education | Other | $29,434 |
| Chemistry | Sciences | $28,912 |
| Accounting | Other | $28,212 |
| Mechanical Engineering | Engineering | $26,775 |
| Civil Engineering | Engineering | $26,180 |
| International Agriculture | Sciences | $23,275 |
While obtaining a master’s typically results in a greater amount of student debt, it can actually depend on your major. For instance, the median debt for a master’s in Computer Science is $35,300, which is $7,500 lower than a bachelor’s in Behavioral Science.
The biggest outlier from this list is Graduate Dentistry and Oral Sciences, with a median debt of $158,155. While this may sound like a lot, it should be compared to the average salary of a U.S. dentist, which according to Indeed is $225,400 per year.


Misc
The Top 25 Nationalities of U.S. Immigrants
Mexico is the largest source of immigrants to the U.S., with almost 11 million immigrants.


The Top 25 Nationalities of U.S. Immigrants
This was originally posted on our Voronoi app. Download the app for free on iOS or Android and discover incredible data-driven charts from a variety of trusted sources.
The United States is home to more than 46 million immigrants, constituting approximately 14% of its total population.
This graphic displays the top 25 countries of origin for U.S. immigrants, based on 2022 estimates. The data is sourced from the Migration Policy Institute (MPI), which analyzed information from the U.S. Census Bureau’s 2022 American Community Survey.
In this context, “immigrants” refer to individuals residing in the United States who were not U.S. citizens at birth.
Mexico Emerges as a Leading Source of Immigration
Mexico stands out as the largest contributor to U.S. immigration due to its geographical proximity and historical ties.
Various economic factors, including wage disparities and employment opportunities, motivate many Mexicans to seek better prospects north of the border.
| Country | Region | # of Immigrants |
|---|---|---|
| 🇲🇽 Mexico | Latin America & Caribbean | 10,678,502 |
| 🇮🇳 India | Asia | 2,839,618 |
| 🇨🇳 China | Asia | 2,217,894 |
| 🇵🇭 Philippines | Asia | 1,982,333 |
| 🇸🇻 El Salvador | Latin America & Caribbean | 1,407,622 |
| 🇻🇳 Vietnam | Asia | 1,331,192 |
| 🇨🇺 Cuba | Latin America & Caribbean | 1,312,510 |
| 🇩🇴 Dominican Republic | Latin America & Caribbean | 1,279,900 |
| 🇬🇹 Guatemala | Latin America & Caribbean | 1,148,543 |
| 🇰🇷 Korea | Asia | 1,045,100 |
| 🇨🇴 Colombia | Latin America & Caribbean | 928,053 |
| 🇭🇳 Honduras | Latin America & Caribbean | 843,774 |
| 🇨🇦 Canada | Northern America | 821,322 |
| 🇯🇲 Jamaica | Latin America & Caribbean | 804,775 |
| 🇭🇹 Haiti | Latin America & Caribbean | 730,780 |
| 🇬🇧 United Kingdom | Europe | 676,652 |
| 🇻🇪 Venezuela | Latin America & Caribbean | 667,664 |
| 🇧🇷 Brazil | Latin America & Caribbean | 618,525 |
| 🇩🇪 Germany | Europe | 537,484 |
| 🇪🇨 Ecuador | Latin America & Caribbean | 518,287 |
| 🇵🇪 Peru | Latin America & Caribbean | 471,988 |
| 🇳🇬 Nigeria | Africa | 448,405 |
| 🇺🇦 Ukraine | Europe | 427,163 |
| 🇮🇷 Iran | Middle East | 407,283 |
| 🇵🇰 Pakistan | Asia | 399,086 |
| Rest of World | 11,637,634 | |
| Total | 46,182,089 |
Mexicans are followed in this ranking by Indians, Chinese, and Filipinos, though most immigrants on this list come from countries in the Latin American and Caribbean region.
On the other hand, only three European countries are among the top sources of U.S. immigrants: the UK, Germany, and Ukraine.
Immigration continues to be a significant factor contributing to the overall growth of the U.S. population. Overall population growth has decelerated over the past decade primarily due to declining birth rates.
Between 2021 and 2022, the increase in the immigrant population accounted for 65% of the total population growth in the U.S., representing 912,000 individuals out of nearly 1.4 million.
If you enjoyed this post, be sure to check out Visualized: Why Do People Immigrate to the U.S.? This visualization shows the different reasons cited by new arrivals to America in 2021.

-

 United States6 days ago
Mapped: Countries Where Recreational Cannabis is Legal
-

 Healthcare2 weeks ago
Life Expectancy by Region (1950-2050F)
-

 Markets2 weeks ago
The Growth of a $1,000 Equity Investment, by Stock Market
-

 Markets2 weeks ago
Mapped: Europe’s GDP Per Capita, by Country
-

 Money2 weeks ago
Charted: What Frustrates Americans About the Tax System
-

 Technology2 weeks ago
Countries With the Highest Rates of Crypto Ownership
-

 Mining2 weeks ago
Where the World’s Aluminum is Smelted, by Country
-

 Personal Finance1 week ago
Visualizing the Tax Burden of Every U.S. State