Mapped: The 10 U.S. States With the Lowest Real GDP Growth
Ranked: The World’s 50 Largest Private Equity Firms
Top 10 Countries Most in Debt to the IMF
Ranked: The Top 6 Economies by Share of Global GDP (1980-2024)
Mapped: Europe’s GDP Per Capita, by Country
Ranked: The Top Startup Cities Around the World
Visualizing the 5 Most Common Cybersecurity Mistakes
Countries With the Highest Rates of Crypto Ownership
Mapped: The Number of AI Startups By Country
All of the Grants Given by the U.S. CHIPS Act
Visualizing America’s Average Retirement Savings, by Age
Visualizing the Tax Burden of Every U.S. State
Charted: What Frustrates Americans About the Tax System
Ranked: The Top 20 Countries in Debt to China
Mapped: Countries Where Recreational Cannabis is Legal
Which Countries Have the Highest Infant Mortality Rates?
Life Expectancy by Region (1950-2050F)
What Causes Preventable Child Deaths?
The Cost of an EpiPen in Major Markets
Who’s Building the Most Solar Energy?
Mapped: The Age of Energy Projects in Interconnection Queues, by State
Ranked: The Top 10 EV Battery Manufacturers in 2023
The World’s Biggest Nuclear Energy Producers
The World’s Biggest Oil Producers in 2023
Mapped: Indian States with Cities Over 1 Million People
Mapped: The Top Export in Each EU Country
Mapped: The Top Exports in Asian Countries
Mapped: U.S. States By Number of Cities Over 250,000 Residents
The Biggest Salt Producing Countries in 2023
Visualizing Copper Production by Country in 2023
Where the World’s Aluminum is Smelted, by Country
Visualizing Global Gold Production in 2023
How People Get Around in America, Europe, and Asia
The Carbon Footprint of Major Travel Methods
Ranking the Top 15 Countries by Carbon Tax Revenue
Ranked: The Countries With the Most Air Pollution in 2023
Top Countries By Forest Growth Since 2001
This infographic examines trends in each generation's media consumption to see how Americans adapted during the pandemic.
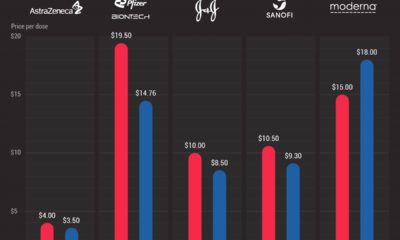
Compared to America, the EU has paid significantly less for a range of COVID-19 vaccines. Here's a look at vaccine prices in each region.
This giant infographic explores the biggest passenger ships on the open seas, over a period of almost 200 years.
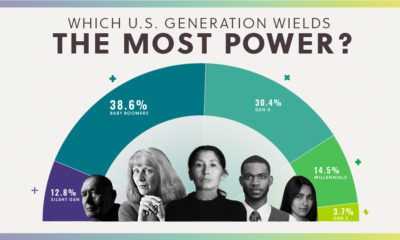
Using data from our new Generational Power Index, we look at how much economic, political, and cultural power each U.S. generation holds.
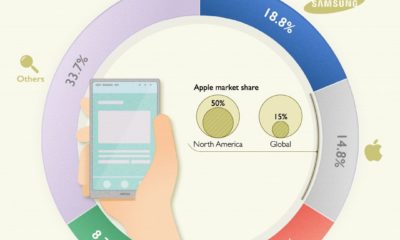
Worldwide smartphone sales decreased by 12% in 2020, but sales are expected to bounce back this year. Will Samsung remain the top dog?
This graphic looks at 29 different psychological tricks that marketers use to try and influence consumer behavior.
This graphic maps out carbon emissions around the world and where they come from, using data from the European Commission.
Here's a sneak preview of features that VC+ members will have delivered straight to their inbox in February 2022.
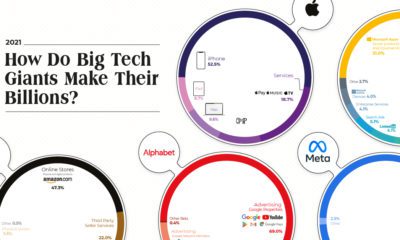
The Big Five tech companies made $1.4 trillion in revenue combined—more than Mexico’s entire GDP. Here's how they earned it all.
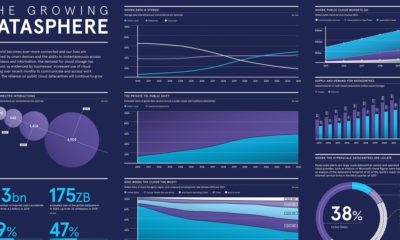
The size of the global datasphere is expected to hit 175 ZB by 2025, and this data is increasingly stored in the cloud.


 Creator Program