Technology
Charting the Massive Scale of the Digital Cloud
View the full-size version of this infographic.

Charting the Massive Scale of the Digital Cloud
View the high resolution of this infographic by clicking here.
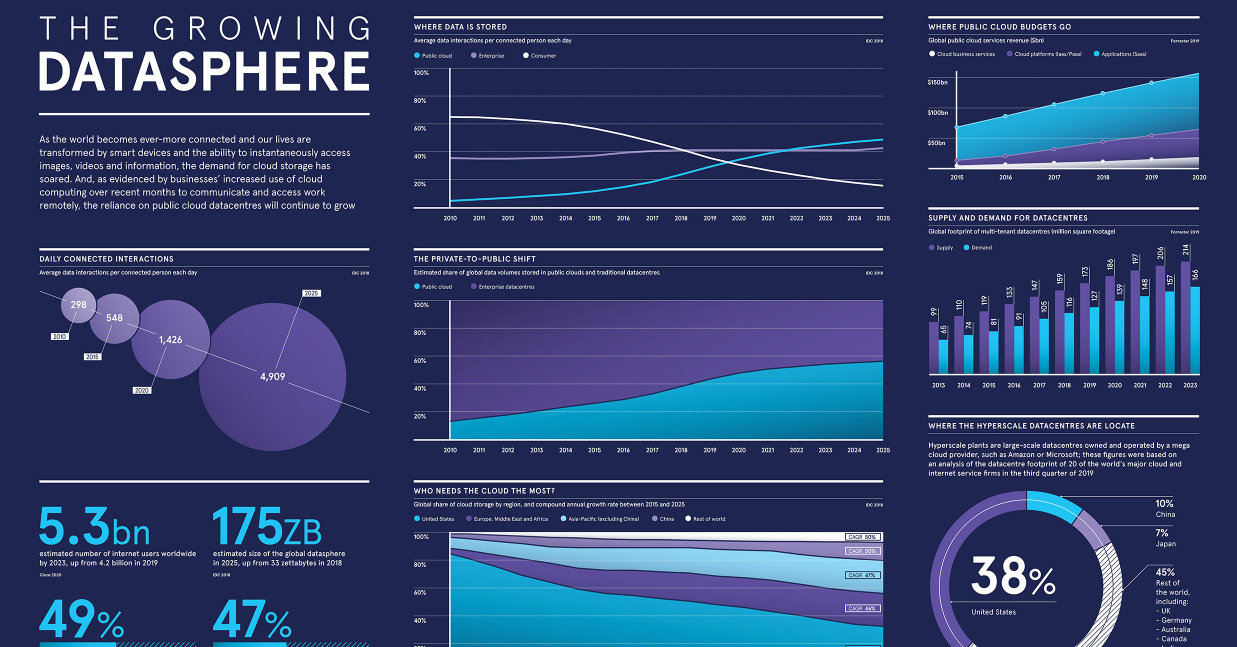
Cloud computing continues to be on the rise, and for good reason. It’s transformed our digital experience in numerous ways, from how we store data to the way we share information online with others.
Growth in cloud services is showing no signs of slowing down, particularly in the data storage realm—by 2025, almost half of the world’s stored data will reside in public cloud environments. Yet, despite its increasing popularity among consumers and businesses alike, do people really understand what the cloud fully entails? Or better yet, what the cloud even is?
Today’s infographic from Raconteur provides an overview of the fast-changing cloud computing landscape, showcasing the industry’s growth and its evolution in scale. It also touches on what’s next for the cloud.
What is Cloud Computing?
Put simply, cloud computing is a network of remote servers that provides customers with a number of offerings, including data storage, processing power, and apps. It’s usually delivered on a pay-per-use basis.
Cloud computing can be broken down into three categories:
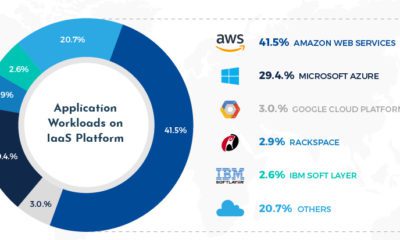
- Infrastructure-as-a-Service (IaaS): Virtual computing services that businesses can utilize over the internet. IaaS allows businesses to scale up resources when needed, and pay for what they use. Microsoft Azure and Amazon Web Services are both IaaS examples.
- Platform-as-a-Service (PaaS): Like IaaS, PaaS utilizes remote infrastructure, but it includes an extra layer by offering tools that developers use to build apps. Examples of PaaS in action include the Google App Engine or OpenShift.
- Software-as-a-Service (Saas): The delivery of apps through remote servers. This is the type of cloud computing most users are familiar with. Examples include Dropbox and Google Apps.
Cloud computing has its obstacles, such as security and privacy risks. Yet, the cloud continues to entice consumers by offering a new level of accessibility to their online experience.
This accessibility has also drastically changed the working world. The cloud allows users to access company servers from anywhere globally, and to share documents and information with colleagues quickly. Because of this, it’s become a key part of remote work.
IaaS: The Backbone of the Cloud
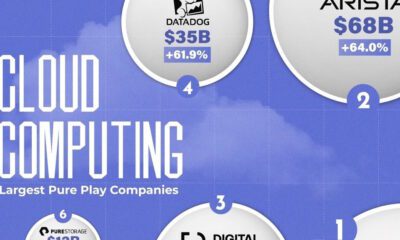
Cloud services are seeing significant growth, and the big tech companies are its backbone.
In fact, four major players combine to dominate almost 60% of the cloud’s infrastructure. Here’s a look at the cloud market breakdown in 2019, and annual growth compared to 2018:
| Service Provider | 2019 Market Share | Annual Growth |
|---|---|---|
| Amazon Web Services | 32.3% | +36.0% |
| Microsoft Azure | 16.9% | +63.9% |
| Google Cloud | 5.8% | +87.8% |
| Alibaba Cloud | 4.9% | +63.8% |
| Others | 40.1% | +23.3% |
It’s no surprise that U.S. companies dominate the cloud service market since the country currently has the largest share of global cloud storage worldwide. Yet, the concentration of cloud storage is predicted to even out in the next few years—by 2025, the U.S. portion of public cloud storage will drop from 51% to 31%, while China’s will increase from just 6% to 13%.
What’s Next for the Cloud?
The cloud has changed the way we use the internet. It has influenced the way we share information, our ability to work remotely, and how we store our data.
And these services are much needed, as our use of data and the internet continues to scale up. By 2025, an average internet user will have around 4,909 data interactions per day, an increase from 1,426 in the year 2020.
At the same time, the scale of global datasphere is expected to be five times bigger in 2025 than it was in 2018, growing from 33 zettabytes to 175 zettabytes. Each zettabyte, by the way, is equal to 1 trillion gigabytes.
With data taking an ever more important role in our lives, the cloud is becoming an indispensable part of business, technology, and society as a whole.


Brands
How Tech Logos Have Evolved Over Time
From complete overhauls to more subtle tweaks, these tech logos have had quite a journey. Featuring: Google, Apple, and more.


How Tech Logos Have Evolved Over Time
This was originally posted on our Voronoi app. Download the app for free on iOS or Android and discover incredible data-driven charts from a variety of trusted sources.
One would be hard-pressed to find a company that has never changed its logo. Granted, some brands—like Rolex, IBM, and Coca-Cola—tend to just have more minimalistic updates. But other companies undergo an entire identity change, thus necessitating a full overhaul.
In this graphic, we visualized the evolution of prominent tech companies’ logos over time. All of these brands ranked highly in a Q1 2024 YouGov study of America’s most famous tech brands. The logo changes are sourced from 1000logos.net.
How Many Times Has Google Changed Its Logo?
Google and Facebook share a 98% fame rating according to YouGov. But while Facebook’s rise was captured in The Social Network (2010), Google’s history tends to be a little less lionized in popular culture.
For example, Google was initially called “Backrub” because it analyzed “back links” to understand how important a website was. Since its founding, Google has undergone eight logo changes, finally settling on its current one in 2015.
| Company | Number of Logo Changes |
|---|---|
| 8 | |
| HP | 8 |
| Amazon | 6 |
| Microsoft | 6 |
| Samsung | 6 |
| Apple | 5* |
Note: *Includes color changes. Source: 1000Logos.net
Another fun origin story is Microsoft, which started off as Traf-O-Data, a traffic counter reading company that generated reports for traffic engineers. By 1975, the company was renamed. But it wasn’t until 2012 that Microsoft put the iconic Windows logo—still the most popular desktop operating system—alongside its name.
And then there’s Samsung, which started as a grocery trading store in 1938. Its pivot to electronics started in the 1970s with black and white television sets. For 55 years, the company kept some form of stars from its first logo, until 1993, when the iconic encircled blue Samsung logo debuted.
Finally, Apple’s first logo in 1976 featured Isaac Newton reading under a tree—moments before an apple fell on his head. Two years later, the iconic bitten apple logo would be designed at Steve Jobs’ behest, and it would take another two decades for it to go monochrome.

-

 Markets1 week ago
Ranked: The Largest U.S. Corporations by Number of Employees
-

 Green3 weeks ago
Ranked: Top Countries by Total Forest Loss Since 2001
-

 Money2 weeks ago
Where Does One U.S. Tax Dollar Go?
-

 Automotive2 weeks ago
Almost Every EV Stock is Down After Q1 2024
-

 AI2 weeks ago
The Stock Performance of U.S. Chipmakers So Far in 2024
-

 Markets2 weeks ago
Charted: Big Four Market Share by S&P 500 Audits
-

 Real Estate2 weeks ago
Ranked: The Most Valuable Housing Markets in America
-

 Money2 weeks ago
Which States Have the Highest Minimum Wage in America?