Mapped: The 10 U.S. States With the Lowest Real GDP Growth
Ranked: The World’s 50 Largest Private Equity Firms
Top 10 Countries Most in Debt to the IMF
Ranked: The Top 6 Economies by Share of Global GDP (1980-2024)
Mapped: Europe’s GDP Per Capita, by Country
Ranked: The Top Startup Cities Around the World
Visualizing the 5 Most Common Cybersecurity Mistakes
Countries With the Highest Rates of Crypto Ownership
Mapped: The Number of AI Startups By Country
All of the Grants Given by the U.S. CHIPS Act
Visualizing America’s Average Retirement Savings, by Age
Visualizing the Tax Burden of Every U.S. State
Charted: What Frustrates Americans About the Tax System
Ranked: The Top 20 Countries in Debt to China
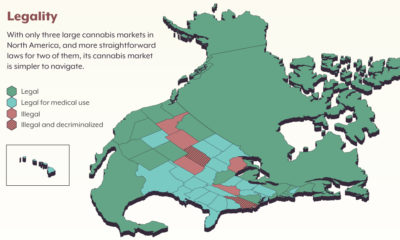
Mapped: Countries Where Recreational Cannabis is Legal
Which Countries Have the Highest Infant Mortality Rates?
Life Expectancy by Region (1950-2050F)
What Causes Preventable Child Deaths?
The Cost of an EpiPen in Major Markets
Who’s Building the Most Solar Energy?
Mapped: The Age of Energy Projects in Interconnection Queues, by State
Ranked: The Top 10 EV Battery Manufacturers in 2023
The World’s Biggest Nuclear Energy Producers
The World’s Biggest Oil Producers in 2023
Mapped: Indian States with Cities Over 1 Million People
Mapped: The Top Export in Each EU Country
Mapped: The Top Exports in Asian Countries
Mapped: U.S. States By Number of Cities Over 250,000 Residents
The Biggest Salt Producing Countries in 2023
Visualizing Copper Production by Country in 2023
Where the World’s Aluminum is Smelted, by Country
Visualizing Global Gold Production in 2023
How People Get Around in America, Europe, and Asia
The Carbon Footprint of Major Travel Methods
Ranking the Top 15 Countries by Carbon Tax Revenue
Ranked: The Countries With the Most Air Pollution in 2023
Top Countries By Forest Growth Since 2001
Have you ever wondered how much copper is in an electric vehicle? This infographic shows the metal's properties as well as the quantity of copper used.
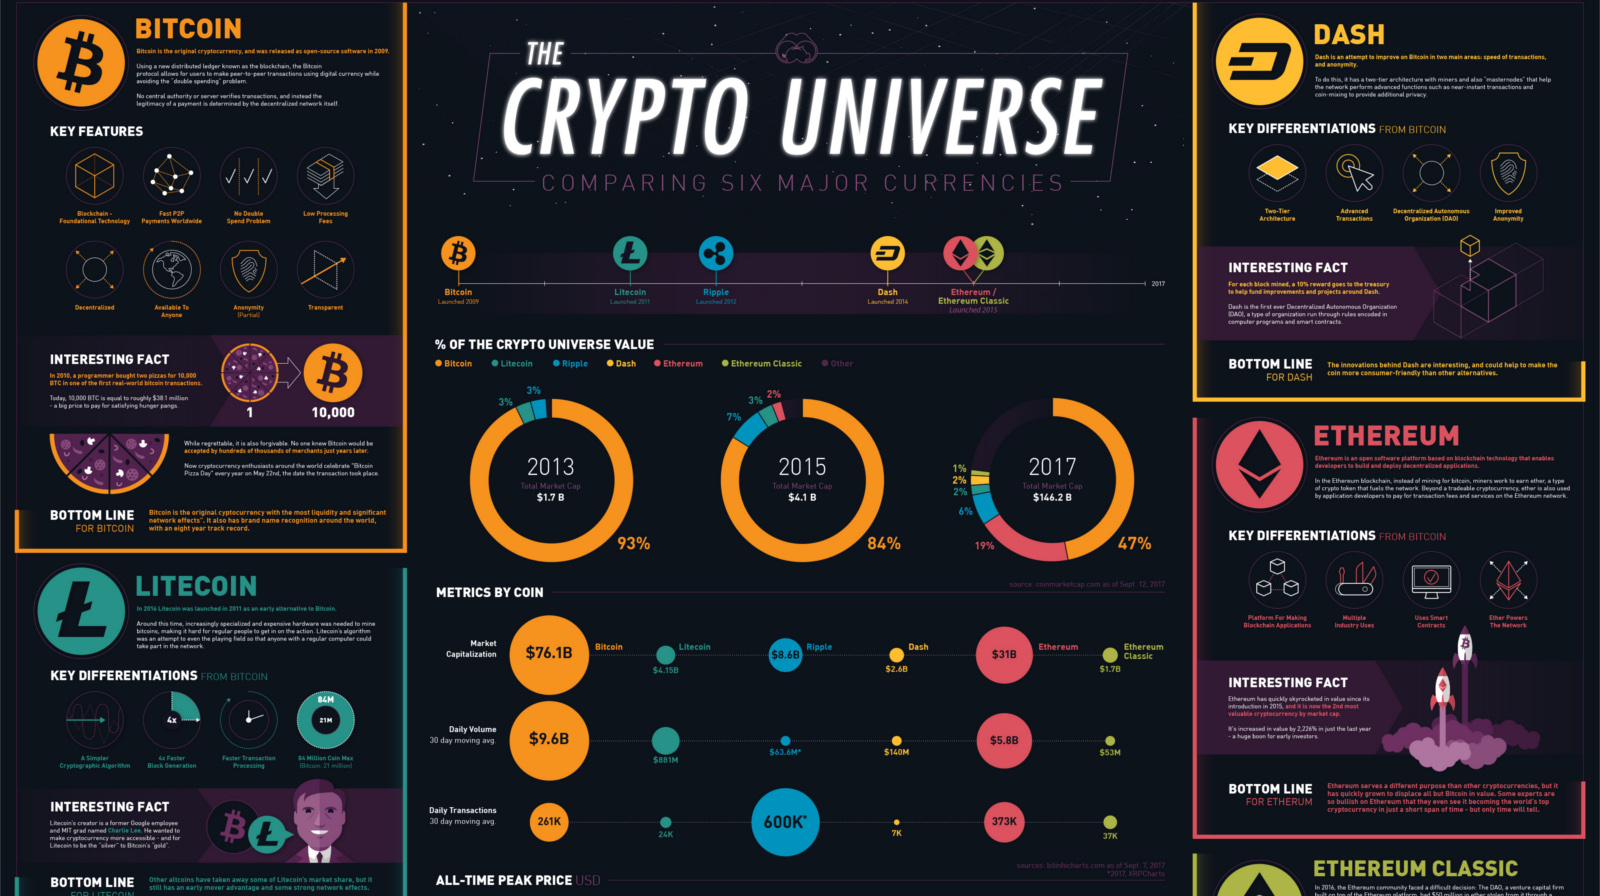
What's the difference between Bitcoin, Ethereum, Dash, Ripple, and Litecoin? This infographic breaks it all down, as well as many other key metrics.
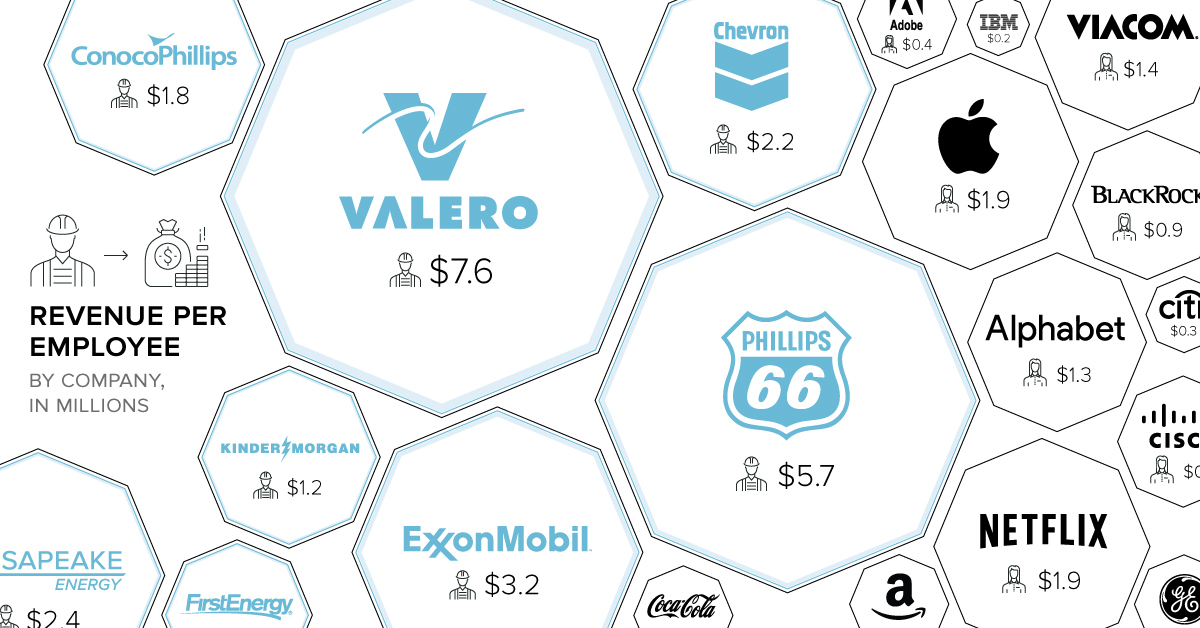
When it comes to revenue per employee, energy companies dominate. On average, oil companies bring in 2x more per employee than companies in other sectors.
The field has been narrowed for the French election, and now just Macron and Le Pen remain. See how they compare head-to-head in this infographic.
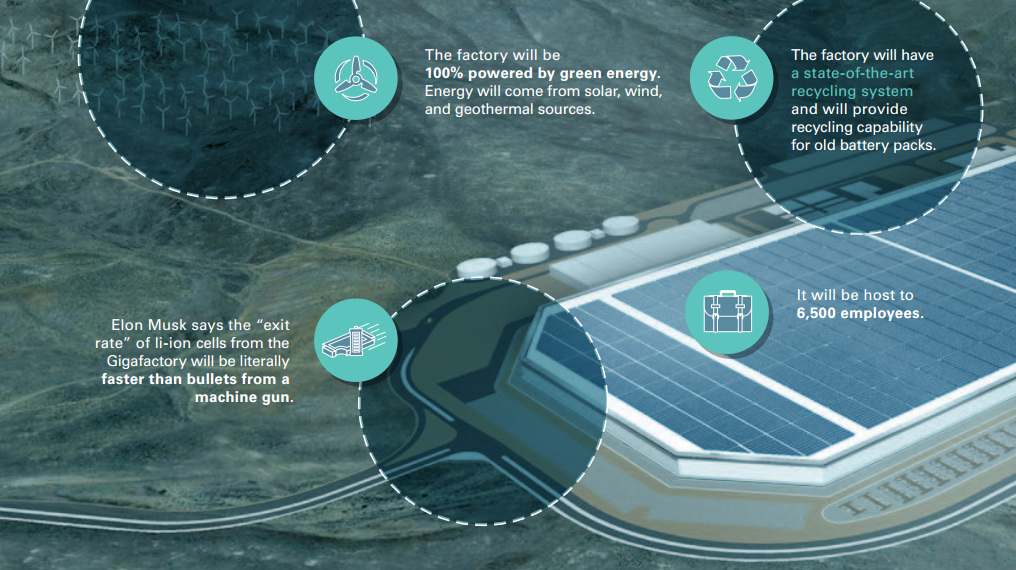
Tesla's giant production facility opens on July 29, and these 9 slides help to visualize the impact of the new Tesla Gigafactory.
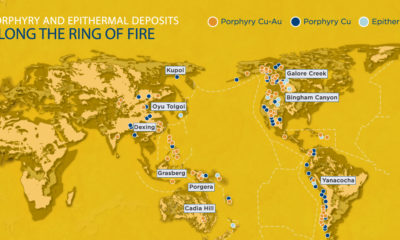
The Pacific Ring of Fire is a 40,000 km long belt of volcanoes, seismic activity, and mineral deposits that surrounds the Pacific Ocean like a necklace...
North America and Europe are the world's most mature and largest cannabis markets, offering immense potential to tap into.
Technology already enables the stock market to be faster and more complex. But what if the actual plumbing behind the market was altered using the blockchain?
The story of one of Canada's richest base metal deposits. Part 2 looks at the high-profile bidding war by major miners for the $4.3 billion nickel...
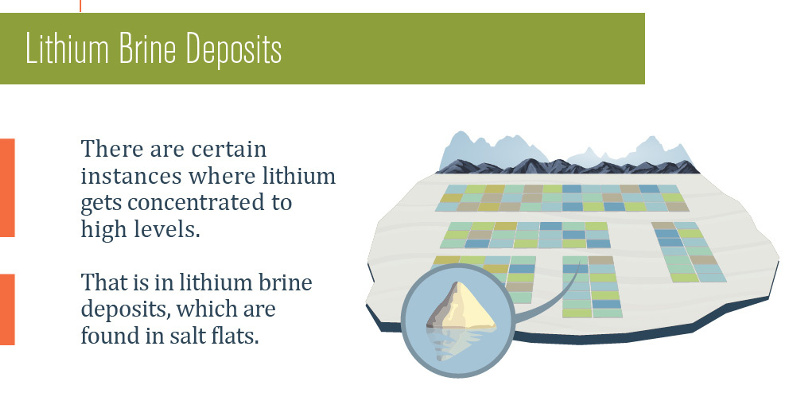
Lithium brine exploration has several benefits associated with it from a cost perspective. In this infographic, we compare it to hard rock exploration and highlight the...