Energy
A Cost Comparison: Lithium Brine vs. Hard Rock Exploration

A Cost Comparison: Lithium Brine vs. Hard Rock Exploration
Lithium brine exploration infographic presented by: Dajin Resources
Capital is limited in the current mining exploration environment, so investors are increasingly looking for companies that have lower costs of doing business. Over the last four years, we’ve seen large-scale, low-grade projects go out of favour and investor preferences resting with low-CAPEX, high-return projects.
However, it is not only the construction costs and scale of a mine with which companies can save money. It can also be in initial prospecting, exploration, and the development of a project. The key here is for a company to be doing this work in a location setting that is easy to work in from logistical and cost perspectives. If a project is in a remote area in mountainous wilderness that requires setup of a camp and bush planes in and out, the payoff has to be that much higher.
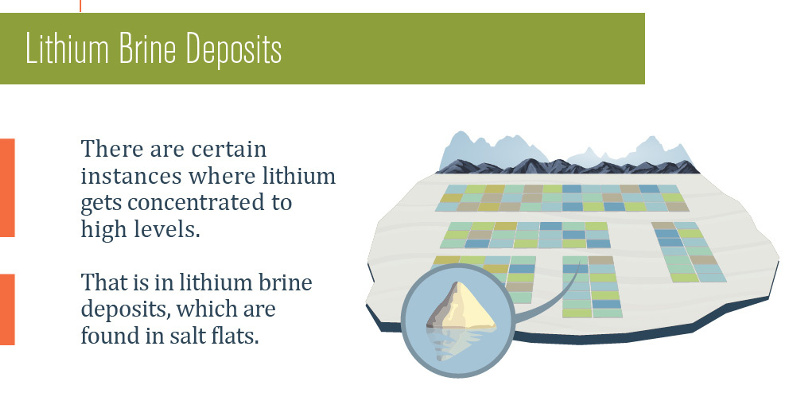
This is where lithium brine deposits come in. Typically, they are located in salars (salt flats) which are flat, arid, and barren areas. This makes the logistics of setting up shop for exploration relatively straightforward, and also removes most topographical challenges of exploration.
Further, there are some other major benefits of lithium brine exploration from a cost perspective that makes it favourable to many hard rock projects. Lithium brine deposits are considered placer deposits and are easier to permit. Brine is also a liquid which means that drilling to find it is more akin to drilling for water, and once it is found the continuity is more straightforward. It’s also typically not located relatively close to surface, which limits the amount of meters drilled.
Once a deposit is discovered, advanced exploration and development can also be at a discount. Drilling wells and testing recovery are more like shallow oil wells or drilling for water. Finally, permitting for construction and production is faster because of the placer classification.
Lithium brine exploration has benefits from the angle of cost that make it less expensive than most comparable hard rock projects. However, their potential also depends on the price of lithium – we cover all of the elements of supply and demand for the light metal in this infographic.
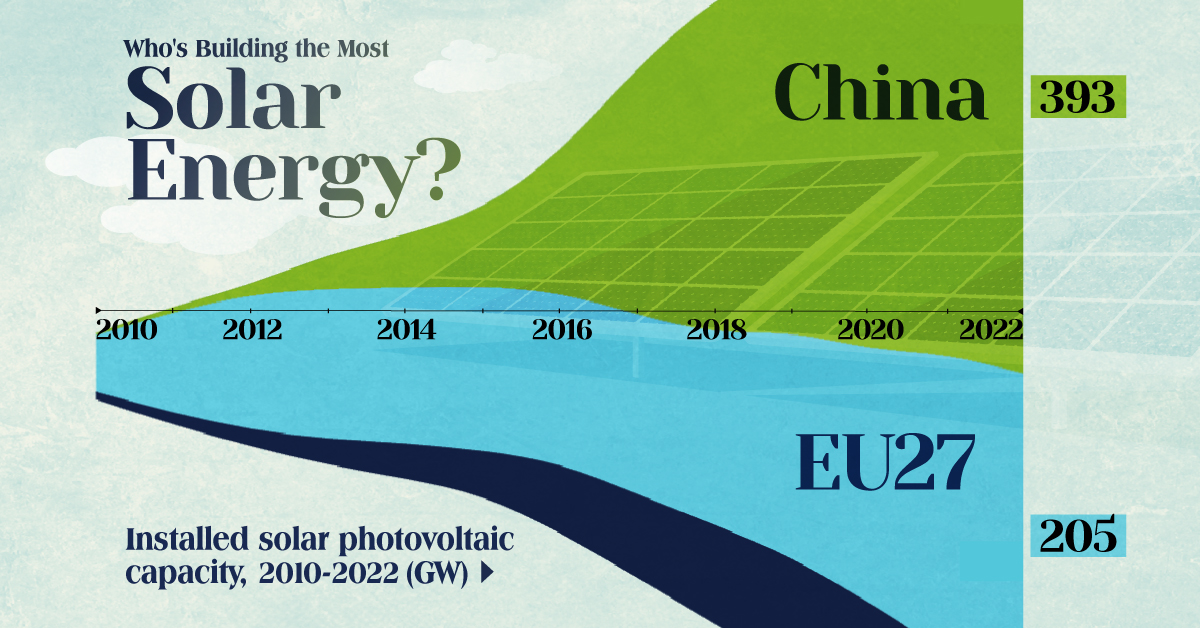
Who’s Building the Most Solar Energy?
This was originally posted on our Voronoi app. Download the app for free on iOS or Android and discover incredible data-driven charts from a variety of trusted sources.
In 2023, solar energy accounted for three-quarters of renewable capacity additions worldwide. Most of this growth occurred in Asia, the EU, and the U.S., continuing a trend observed over the past decade.
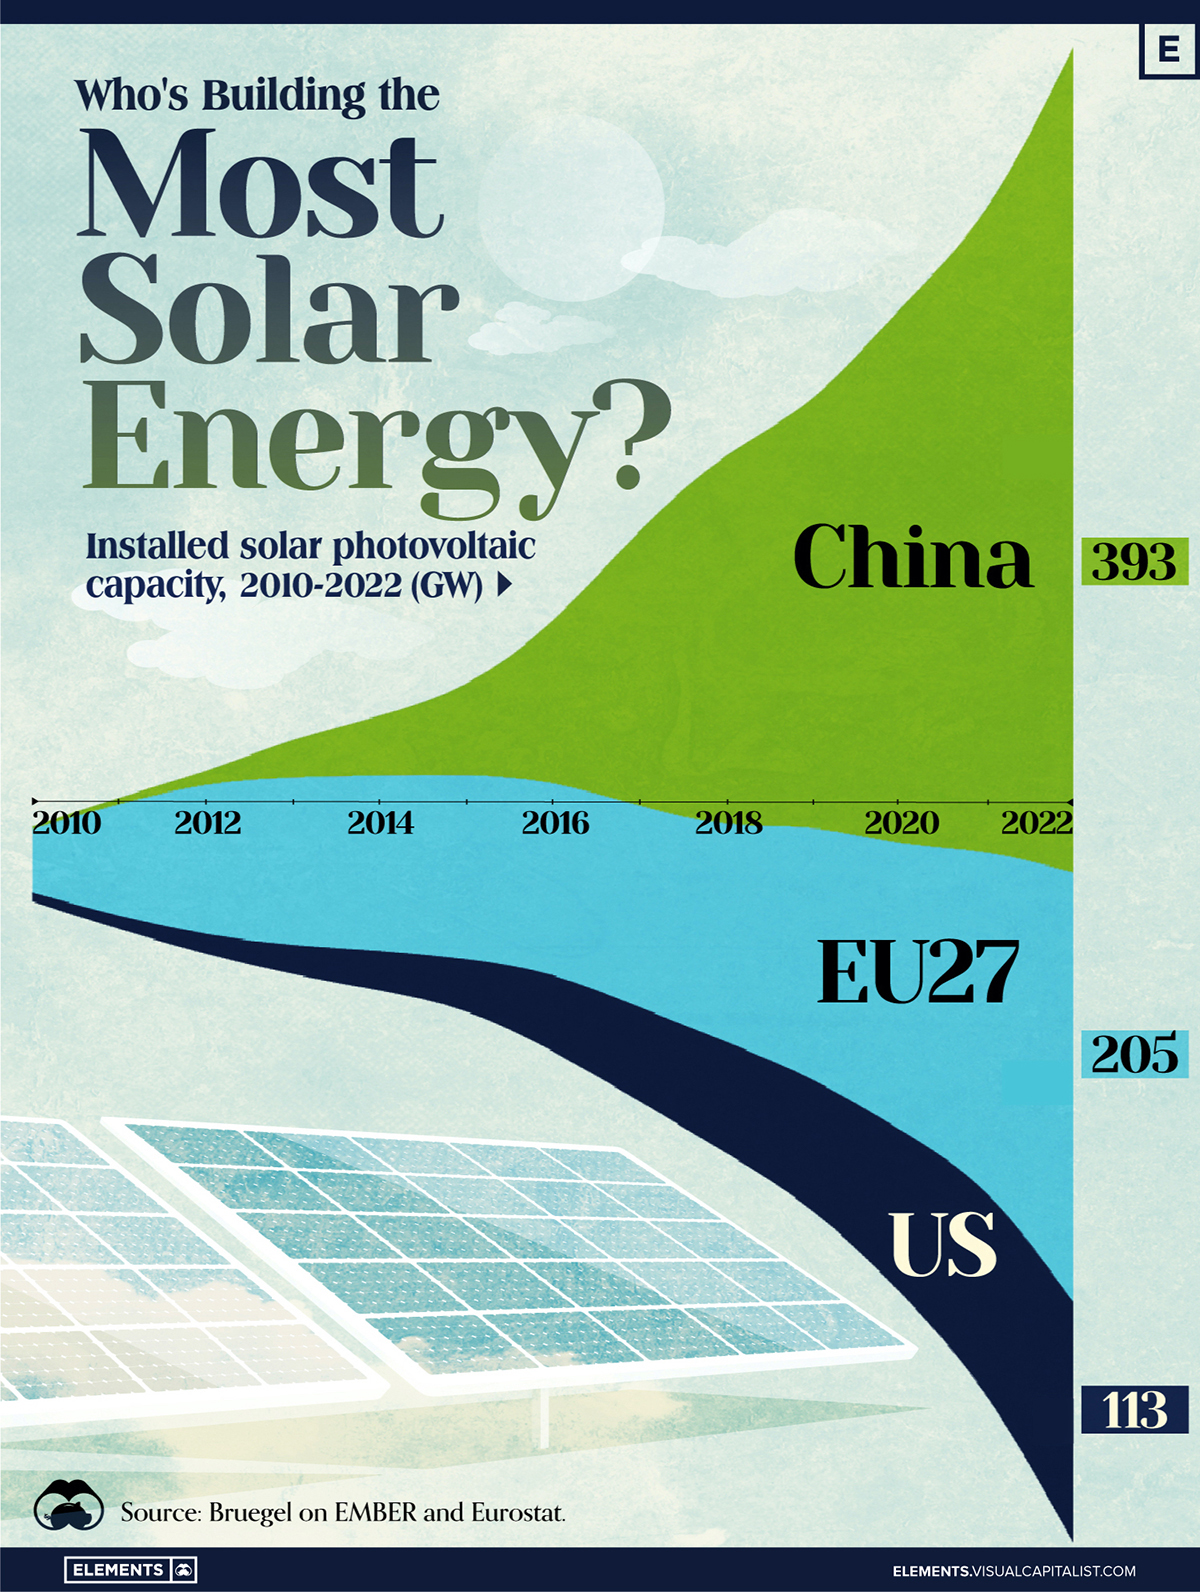
In this graphic, we illustrate the rise in installed solar photovoltaic (PV) capacity in China, the EU, and the U.S. between 2010 and 2022, measured in gigawatts (GW). Bruegel compiled the data..
Chinese Dominance
As of 2022, China’s total installed capacity stands at 393 GW, nearly double that of the EU’s 205 GW and surpassing the USA’s total of 113 GW by more than threefold in absolute terms.
| Installed solar capacity (GW) | China | EU27 | U.S. |
|---|---|---|---|
| 2022 | 393.0 | 205.5 | 113.0 |
| 2021 | 307.0 | 162.7 | 95.4 |
| 2020 | 254.0 | 136.9 | 76.4 |
| 2019 | 205.0 | 120.1 | 61.6 |
| 2018 | 175.3 | 104.0 | 52.0 |
| 2017 | 130.8 | 96.2 | 43.8 |
| 2016 | 77.8 | 91.5 | 35.4 |
| 2015 | 43.6 | 87.7 | 24.2 |
| 2014 | 28.4 | 83.6 | 18.1 |
| 2013 | 17.8 | 79.7 | 13.3 |
| 2012 | 6.7 | 71.1 | 8.6 |
| 2011 | 3.1 | 53.3 | 5.6 |
| 2010 | 1.0 | 30.6 | 3.4 |
Since 2017, China has shown a compound annual growth rate (CAGR) of approximately 25% in installed PV capacity, while the USA has seen a CAGR of 21%, and the EU of 16%.
Additionally, China dominates the production of solar power components, currently controlling around 80% of the world’s solar panel supply chain.
In 2022, China’s solar industry employed 2.76 million individuals, with manufacturing roles representing approximately 1.8 million and the remaining 918,000 jobs in construction, installation, and operations and maintenance.
The EU industry employed 648,000 individuals, while the U.S. reached 264,000 jobs.
According to the IEA, China accounts for almost 60% of new renewable capacity expected to become operational globally by 2028.
Despite the phasing out of national subsidies in 2020 and 2021, deployment of solar PV in China is accelerating. The country is expected to reach its national 2030 target for wind and solar PV installations in 2024, six years ahead of schedule.
-

 Markets5 days ago
Mapped: The Most Valuable Company in Each Southeast Asian Country
-

 Markets2 weeks ago
The Top Private Equity Firms by Country
-

 Jobs2 weeks ago
The Best U.S. Companies to Work for According to LinkedIn
-

 Economy2 weeks ago
Ranked: The Top 20 Countries in Debt to China
-

 Politics2 weeks ago
Charted: Trust in Government Institutions by G7 Countries
-

 Energy1 week ago
Mapped: The Age of Energy Projects in Interconnection Queues, by State
-

 Mining1 week ago
Visualizing Global Gold Production in 2023
-

 Markets1 week ago
Visualized: Interest Rate Forecasts for Advanced Economies

