Sponsored
A Bird’s Eye View of the World’s Largest Cannabis Markets
The following content is sponsored by Tenacious Labs.
A Bird’s Eye View of the World’s Largest Cannabis Markets
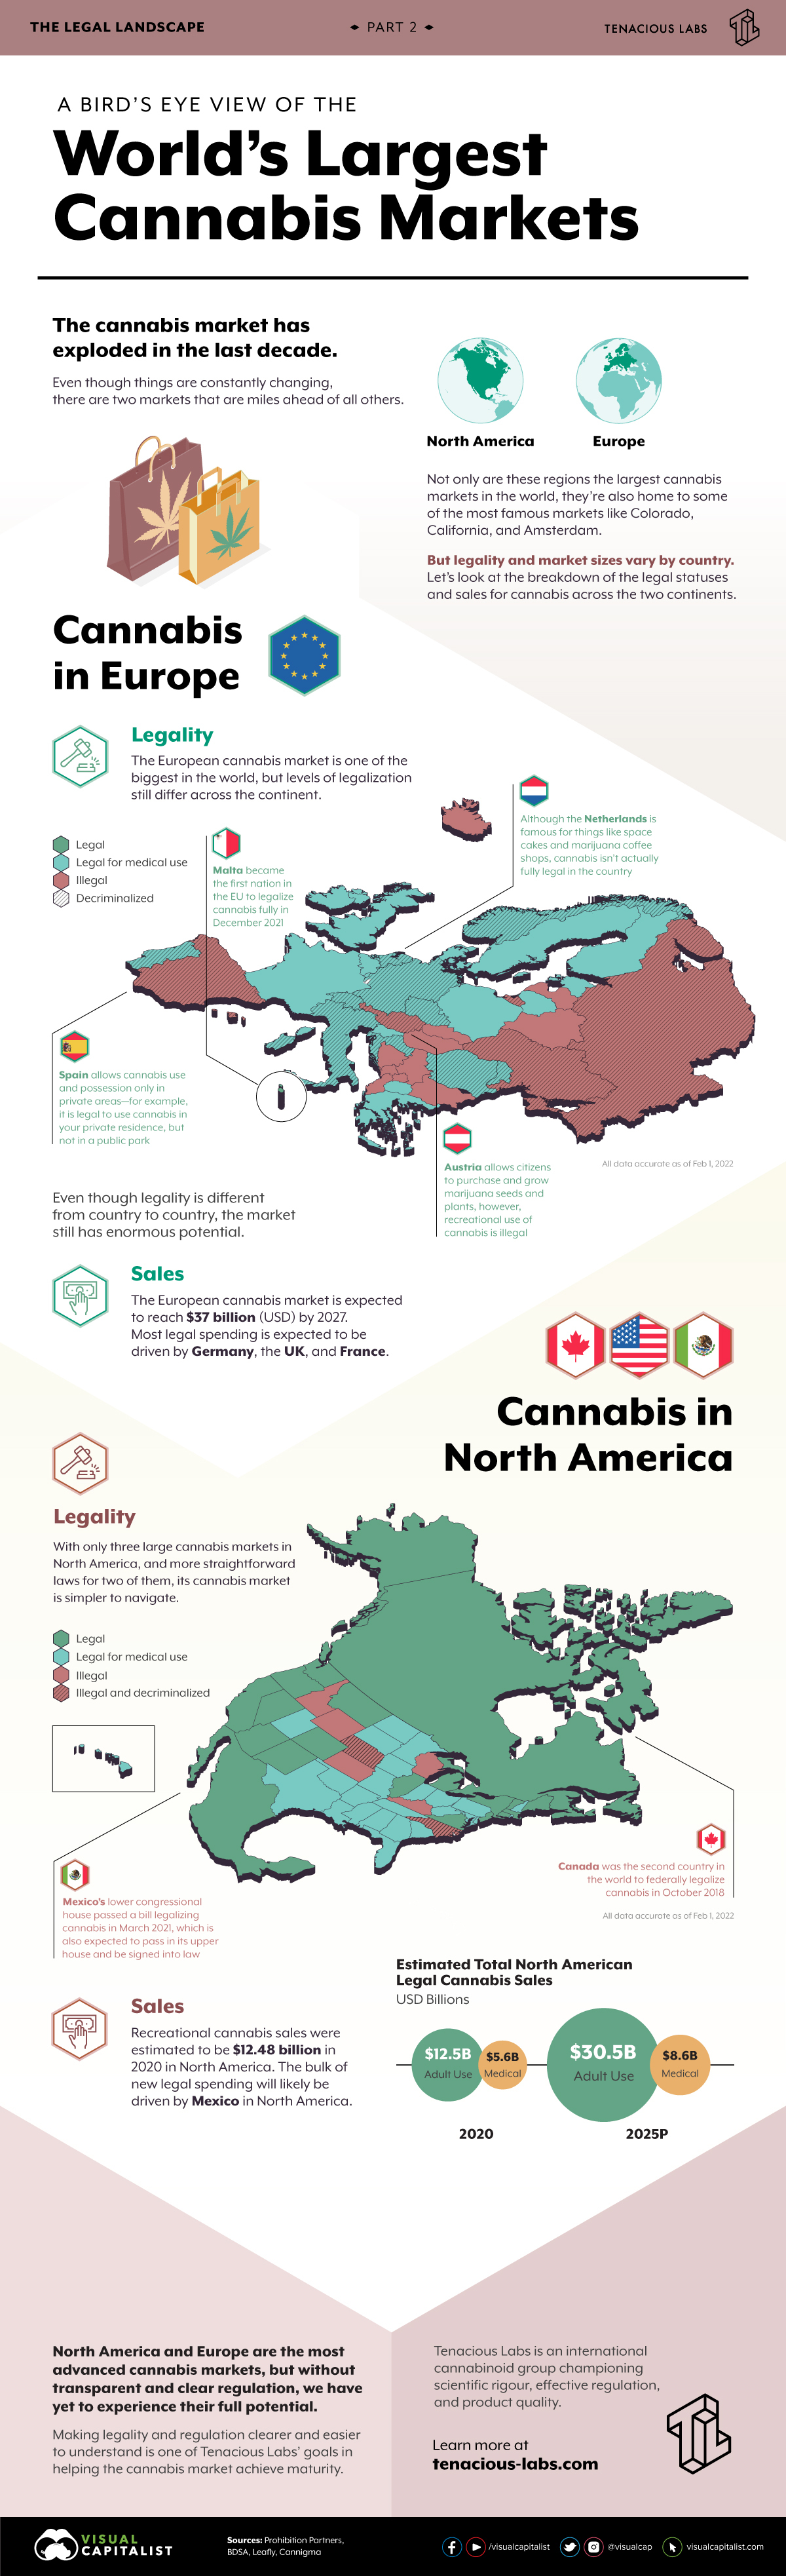
North America and Europe are home to some of the world’s most famous cannabis cultures, such as California and Amsterdam.
However, even in these undoubtedly successful markets, cannabis legality varies by country—and as this graphic by Tenacious Labs explores, so does its subsequent market value.
The European Cannabis Market
Although the European Union is one single economic market with agreed upon laws and regulations, individual countries still have their say on national laws. Looking at Europe as a region reshapes things again as countries like the UK are outside the EU—further muddying cannabis laws and regulation.
Here is an overview of cannabis’ legal status by European country:
Country | Legal Status |
---|---|
🇦🇱 Albania | Illegal |
🇦🇩 Andorra | Illegal |
🇦🇲 Armenia | Illegal |
🇦🇹 Austria | Illegal, decriminalized |
🇧🇾 Belarus | Illegal |
🇧🇦 Bosnia and Herzegovina | Illegal |
🇧🇪 Belgium | Legal for medical use |
🇧🇬 Bulgaria | Illegal |
🇨🇿 Czech Republic | Legal for medical use, decriminalized |
🇭🇷 Croatia | Legal for medical use, decriminalized |
🇩🇰 Denmark | Legal for medical use |
🇪🇪 Estonia | Legal for medical use |
🇫🇮 Finland | Legal for medical use |
🇫🇷 France | Legal for medical use |
🇬🇪 Georgia | Illegal |
🇩🇪 Germany | Legal for medical use, decriminalized |
🇬🇷 Greece | Legal for medical use |
🇭🇺 Hungary | Illegal |
🇮🇸 Iceland | Illegal |
🇮🇪 Ireland | Legal for medical use |
🇮🇹 Italy | Legal for medical use, decriminalized |
🇽🇰 Kosovo | Illegal |
🇱🇻 Latvia | Illegal |
🇱🇮 Liechtenstein | Illegal |
🇱🇹 Lithuania | Legal for medical use |
🇱🇺 Luxembourg | Legal for medical use, decriminalized |
🇲🇹 Malta | Legal |
🇲🇩 Moldova | Illegal, decriminalized |
🇲🇨 Monaco | Illegal |
🇲🇪 Montenegro | Illegal |
🇳🇱 Netherlands | Legal for medical use, decriminalized |
🇲🇰 North Macedonia | Legal for medical use |
🇳🇴 Norway | Legal for medical use, decriminalized |
🇵🇱 Poland | Legal for medical use |
🇵🇹 Portugal | Legal for medical use, decriminalized |
🇷🇴 Romania | Legal for medical use, decriminalized |
🇷🇺 Russia | Illegal, decriminalized |
🇸🇲 San Marino | Legal for medical use |
🇷🇸 Serbia | Illegal |
🇸🇰 Slovakia | Illegal |
🇸🇮 Slovenia | Legal for medical use |
🇪🇸 Spain | Illegal, decriminalized |
🇸🇪 Sweden | Legal for medical use |
🇨🇭 Switzerland | Legal for medical use, decriminalized |
🇺🇦 Ukraine | Illegal, decriminalized |
🇬🇧 United Kingdom | Legal for medical use |
Regardless, there is immense potential in the European cannabis market—it is expected to be worth $37 billion by 2027. The biggest markets driving this are Germany, the UK, and France.
As of December 2021, Malta became the first European country to fully legalize recreational cannabis. Three other countries have also started the process towards legalization, and a number of others are expected to fully legalize in the next few years, namely:
- Germany
- Luxembourg
- The Netherlands
- Spain
- Switzerland
On average, 1 in 10 Europeans use cannabis every year. With little legality for recreational cannabis, this high demand has to be met by the illegal market. As a result, yearly illicit cannabis market sales are estimated at around €11 billion (US$13 billion)—representing significant untapped potential.
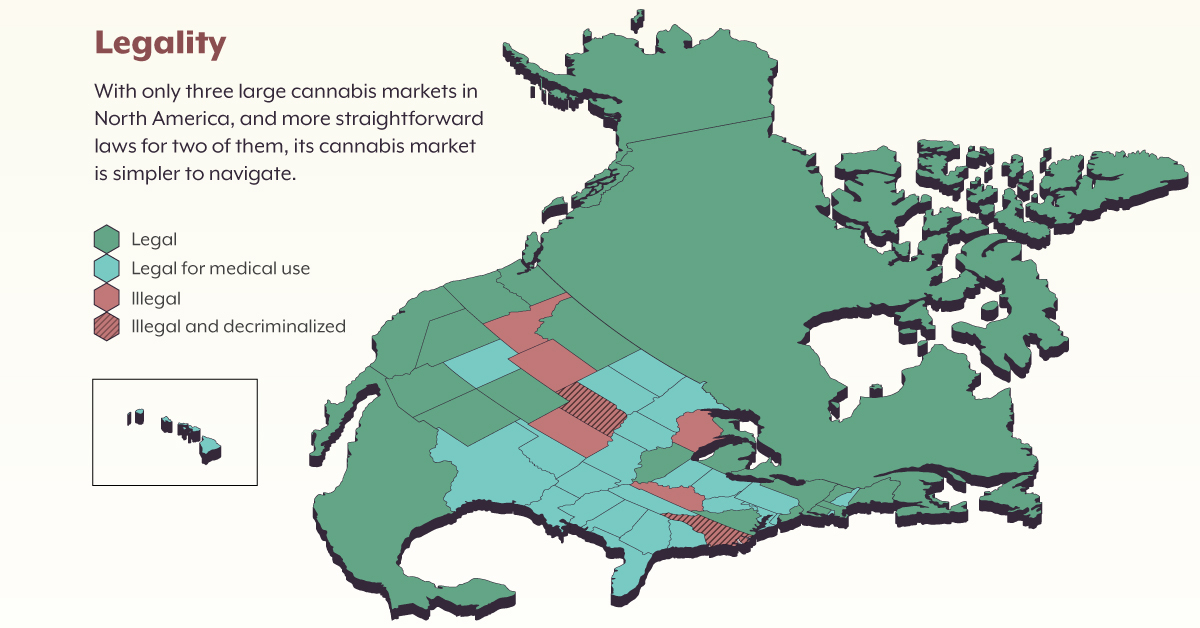
The North American Cannabis Market
The U.S., Canada, and Mexico make up the world’s largest continental cannabis market, worth $18.1 billion in 2020. In Canada, cannabis is federally legal, and Mexico will soon be in the same boat. The U.S., however, is a different story.
America’s stance on cannabis legality varies on a state-by-state basis. Federally, cannabis is illegal—listed as a Schedule I drug, alongside heroin. But individual states have their own laws, from states with fully legal recreational cannabis to medical usage only permitted, and full illegality.
State | State Level Legal Status Of Cannabis |
---|---|
Alabama | Legal for medical use |
Alaska | Legal |
Arizona | Legal |
Arkansas | Legal for medical use |
California | Legal |
Colorado | Legal |
Connecticut | Legal |
Delaware | Legal for medical use |
Florida | Legal for medical use |
Georgia | Legal for medical use |
Hawaii | Legal for medical use |
Idaho | Illegal |
Illinois | Legal |
Indiana | Legal for medical use |
Iowa | Legal for medical use |
Kansas | Illegal |
Kentucky | Illegal |
Louisiana | Legal for medical use |
Maine | Legal |
Maryland | Legal for medical use |
Massachusetts | Legal |
Michigan | Legal |
Minnesota | Legal for medical use |
Mississippi | Legal for medical use |
Missouri | Legal for medical use |
Montana | Legal |
Nebraska | Illegal, decriminalized |
Nevada | Legal |
New Hampshire | Legal for medical use |
New Jersey | Legal |
New Mexico | Legal |
New York | Legal |
North Carolina | Legal for medical use |
North Dakota | Legal for medical use |
Ohio | Legal for medical use |
Oklahoma | Legal for medical use |
Oregon | Legal |
Pennsylvania | Legal for medical use |
Rhode Island | Legal for medical use |
South Carolina | Legal for medical use |
South Dakota | Legal for medical use |
Tennessee | Legal for medical use (Limited) |
Texas | Legal for medical use (Limited) |
Utah | Legal for medical use |
Vermont | Legal |
Virginia | Legal |
Washington | Legal |
Washington, DC | Legal |
West Virginia | Legal for medical use |
Wisconsin | Illegal |
Wyoming | Illegal |
The U.S. has the biggest cannabis market potential in North America by far.
In states where cannabis has been fully legal for years—like Colorado—countless jobs and revenue have been added to the state’s economy and in such markets, regulation is pushing the industry towards maturity. In contrast, in states like Wyoming it is still illegal to be ‘under the influence’ of cannabis.
This stark contrast within one country hinders the market potential of the entire continent. However, the MORE (Marijuana Opportunity Reinvestment and Expungement) Act was recently reintroduced in the U.S.’ House of Representatives. If passed, it would remove cannabis from its classification as a Schedule I drug.
Cannabis Markets with Huge Potential
North America and Europe are the most advanced cannabis markets, but without transparent and clear regulation, we have yet to experience their full potential.
Treaties like USMCA in North America, and the economic union for most European countries, offer the chance for the world to benefit from the highly lucrative cannabis market.
In the next part of The Legal Landscape Series, we will take a deep dive into the cannabis market in the United States.
Support the Future of Data Storytelling
Sorry to interrupt your reading, but we have a favor to ask. At Visual Capitalist we believe in a world where data can be understood by everyone. That’s why we want to build the VC App - the first app of its kind combining verifiable and transparent data with beautiful, memorable visuals. All available for free.
As a small, independent media company we don’t have the expertise in-house or the funds to build an app like this. So we’re asking our community to help us raise funds on Kickstarter.
If you believe in data-driven storytelling, join the movement and back us on Kickstarter!
Thank you.

Sponsored
How Ending Tropical Deforestation Can Keep Global Warming Below 1.5°C
Tropical deforestation is a culprit of carbon emissions—which makes protecting forests crucial to keep to the Paris Agreement 1.5°C pathway.

How Ending Tropical Deforestation Can Keep Global Warming Below 1.5°C
In the case of global warming, a few degrees make all the difference.
The United Nations’ latest IPCC report emphasizes that the Earth is on a collision course with catastrophic climate change—that is unless, in line with the 2015 Paris Agreement, the global rise in temperatures can be limited to 1.5°C.
To achieve this however, the world will need to significantly reduce its carbon emissions. Today’s graphic from The LEAF Coalition highlights how protecting forests is essential to this process.
Tropical Deforestation: A Carbon Emissions Culprit
According to the World Economic Forum, to keep to a 1.5°C pathway by 2030, we’ll need to cut greenhouse gas emissions in half. For this trajectory to be maintained in 2050, emissions need to be completely eliminated.
However, tropical deforestation accounts for 10% of global carbon (CO₂) emissions today, which is comparable to the emissions outputs of entire countries.
Est. Annual CO₂e Emissions | |
---|---|
🇨🇳 China | 12.4 Gt/year |
🇺🇸 U.S. | 6.0 Gt/year |
🌳 Tropical tree cover loss | 5.3 Gt/year |
In fact, combined emissions from tropical tree cover loss, including activities of deforestation, rival annual emissions from major emitters, coming in third just after China and the United States.
Protecting Forests is Key
The urgency of ending tropical deforestation to curb emissions cannot be understated. If in the previously mentioned 2030 scenario, it is assumed that emissions have already dropped steeply, deforestation today would still need to be cut by 75% in order to maintain the possibility of keeping to the 1.5°C pathway.
However, there’s a significant barrier—the FAO estimates that we are losing 10 million hectares of forests every year. To put that into perspective, that’s a loss equal to the size of New York’s Central Park every 18 minutes.
For these crucial reasons, urgent collective action is needed to protect forests. Find out how The LEAF Coalition, a public-private initiative is bringing together businesses to do more to fight climate change and halt tropical deforestation.
Sponsored
ESG Data: The Four Motivations Driving Usage
ESG controversies can damage a company’s value, but ESG data may be able to help manage this risk. What are other reasons for using ESG data?

ESG Data: The Four Motivations Driving Usage
Data is key to the environmental, social, and governance (ESG) revolution. Access to granular ESG data can help boost transparency for market participants. Unfortunately, 63% of U.S. and European asset managers say a lack of quantitative data inhibits their ESG implementation.
Being clear on the potential application of this data is equally important.
- Investors and banks can use ESG data for risk assessment, to spot opportunities, and to push companies for change.
- Companies can publish their own ESG data, quantify progress on their ESG goals, and use data to inform decisions.
- Policymakers can use ESG data to inform regulatory frameworks and measure policy effectiveness.
This graphic from ICE, the second in a three part series on the ESG toolkit, explores four primary motivations of ESG data users.
1. Right Thing
The objective: Having a positive social or environmental impact.
For investors, this can involve screening out companies that conflict with their values and selecting companies that align with their ESG objectives.
As another example, it can involve comparing the social impact of municipal bonds. One way investors can measure social impact is through scores that quantify the potential socioeconomic need of an area, using metrics like poverty and education levels. Here are the social impact scores for three actual municipal bonds issued in Florida.
State | Bond Issuer | Social Impact Score (Higher = larger potential impact) |
---|---|---|
Florida | Issuer #1 | 76.5 |
Florida | Issuer #2 | 66.6 |
Florida | Issuer #3 | 43.2 |
Issuer #1’s bond is projected to have a community impact that is nearly twice as high/positive as Issuer #3’s bond.
For companies, doing the right thing can include assessing their progress on ESG goals and benchmarking themselves to peers. For example, gender and racial representation is a growing area of focus.
2. Risk
The objective: Managing ESG risks, such as climate and reputational risks.
For investors, this can involve back-testing or analysis around specific risk events before they materialize. Here are the risk profiles of two actual municipal bonds in California. The shown bonds are practically identical in many ways, except their wildlife score.
Issuer #1 | Issuer #2 | |
---|---|---|
Current Coupon Rate | 5.0% | 5.0% |
Maturity Date | Aug 01, 2048 | August 01, 2048 |
S&P Rating | AA | AA |
Price to Date (Call Date) | Aug 01, 2027 | Aug 01, 2027 |
Price | 122.0 | 122.0 |
Yield | 1.0% | 1.0% |
Wildfire Score (Higher = more risk) | 3.6 | 2.7 |
Managing ESG risk can also involve analyzing a company’s policies and governance for weaknesses. This is important as an ESG controversy can have long-lasting effects on the valuation of a company.
In one study, companies with ESG controversies dropped more than 10% in value relative to the S&P 500. They hadn’t fully recovered a year after the incident.
3. Revenue
The objective: Targeting outperformance through ESG analysis.
Selecting companies with strong ESG data can align with long-term growth trends and may help boost performance. For heavy emitting industries, research indicates that European companies with lower emissions trade at much higher valuations. The chart below shows companies’ price-to-book ratio relative to the Stoxx 600* sector median.
Utilities | Energy | Materials | |
---|---|---|---|
Above Median Emission Intensity (Bad) | 1.9 | 1.1 | 2.0 |
Below Median Emissions Intensity (Good) | 2.7 | 1.9 | 2.1 |
*The Stoxx 600 Index represents large, mid and small capitalization companies across 17 countries of the European region: Austria, Belgium, Denmark, Finland, France, Germany, Ireland, Italy, Luxembourg, the Netherlands, Norway, Poland, Portugal, Spain, Sweden, Switzerland and the United Kingdom.
Energy companies with low emissions trade at a valuation nearly two times higher than energy companies with high emissions.
4. Regulation
The objective: Understanding and complying with relevant ESG regulation.
The International Sustainability Standards Board has announced a global reporting proposal aligned with the Task Force on Climate-related Financial Disclosures (TCFD). In addition, a growing number of jurisdictions will require organizational reporting that aligns with the TCFD.
- Brazil
- European Union
- Hong Kong
- Japan
- New Zealand
- Singapore
- Switzerland
- UK
Not only that, a European Union regulation known as Sustainable Finance Disclosure Regulation (SFDR) came into effect in 2021. It seeks greater transparency in disclosures from firms marketing investment products. Even firms located outside the EU could be impacted if they serve EU customers. In total, the market cap of these non-EU companies exposed to SFDR amounts to $3.2 trillion.
Matching ESG Data with Motivation
There will be growing demand for transparent data as ESG investing flourishes. To remain competitive, investors, policymakers, and companies need access to ESG data that meets their unique objectives.
In Part 3 of the ESG Toolkit series sponsored by ICE, we’ll look at key sustainability index types.
-
Money3 weeks ago
Mapping the Migration of the World’s Millionaires
-
Energy1 week ago
Who’s Still Buying Fossil Fuels From Russia?
-
Markets3 weeks ago
Visualizing the Coming Shift in Global Economic Power (2006-2036p)
-
Datastream4 weeks ago
Ranked: These Are 10 of the World’s Least Affordable Housing Markets
-
Demographics3 weeks ago
Mapped: A Decade of Population Growth and Decline in U.S. Counties
-
Misc4 weeks ago
Visualizing Well-Known Airlines by Fleet Composition
-
Misc3 weeks ago
Iconic Infographic Map Compares the World’s Mountains and Rivers
-
Markets2 weeks ago
Interest Rate Hikes vs. Inflation Rate, by Country