Mapped: The 10 U.S. States With the Lowest Real GDP Growth
Ranked: The World’s 50 Largest Private Equity Firms
Top 10 Countries Most in Debt to the IMF
Ranked: The Top 6 Economies by Share of Global GDP (1980-2024)
Mapped: Europe’s GDP Per Capita, by Country
Countries With the Highest Rates of Crypto Ownership
Mapped: The Number of AI Startups By Country
All of the Grants Given by the U.S. CHIPS Act
Visualizing AI Patents by Country
How Tech Logos Have Evolved Over Time
Visualizing America’s Average Retirement Savings, by Age
Visualizing the Tax Burden of Every U.S. State
Charted: What Frustrates Americans About the Tax System
Ranked: The Top 20 Countries in Debt to China
Mapped: Countries Where Recreational Cannabis is Legal
Which Countries Have the Highest Infant Mortality Rates?
Life Expectancy by Region (1950-2050F)
What Causes Preventable Child Deaths?
The Cost of an EpiPen in Major Markets
Who’s Building the Most Solar Energy?
Mapped: The Age of Energy Projects in Interconnection Queues, by State
Ranked: The Top 10 EV Battery Manufacturers in 2023
The World’s Biggest Nuclear Energy Producers
The World’s Biggest Oil Producers in 2023
Mapped: The Top Exports in Asian Countries
Mapped: U.S. States By Number of Cities Over 250,000 Residents
Mapped: U.S. Immigrants by Region
The Biggest Salt Producing Countries in 2023
Visualizing Copper Production by Country in 2023
Where the World’s Aluminum is Smelted, by Country
Visualizing Global Gold Production in 2023
How People Get Around in America, Europe, and Asia
The Carbon Footprint of Major Travel Methods
Ranking the Top 15 Countries by Carbon Tax Revenue
Ranked: The Countries With the Most Air Pollution in 2023
Top Countries By Forest Growth Since 2001
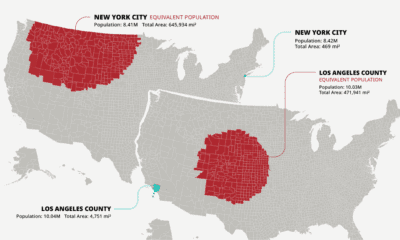
The U.S. population is spread across a huge amount of land, but its distribution is far from equal. These maps are a unique look at population...
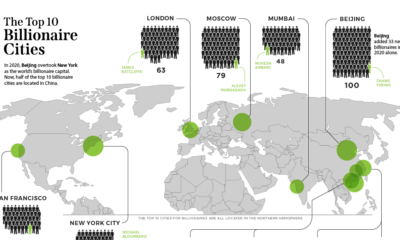
Where do the most billionaires live? For years, NYC has topped the list of billionaire cities, but 2020 marked a monumental shift.
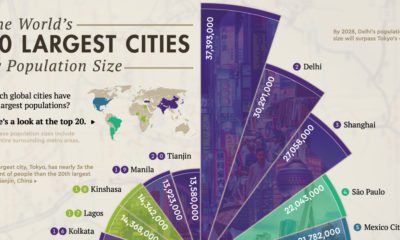
Where are the world’s largest cities in terms of population? This graphic looks at the top 20 most populous cities in the world.
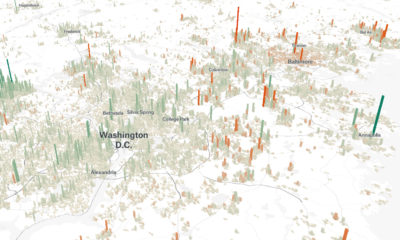
Cities are constantly evolving over time. These 3d graphics visualize both growth and decline with a focus on North American cities from 1990-2015.
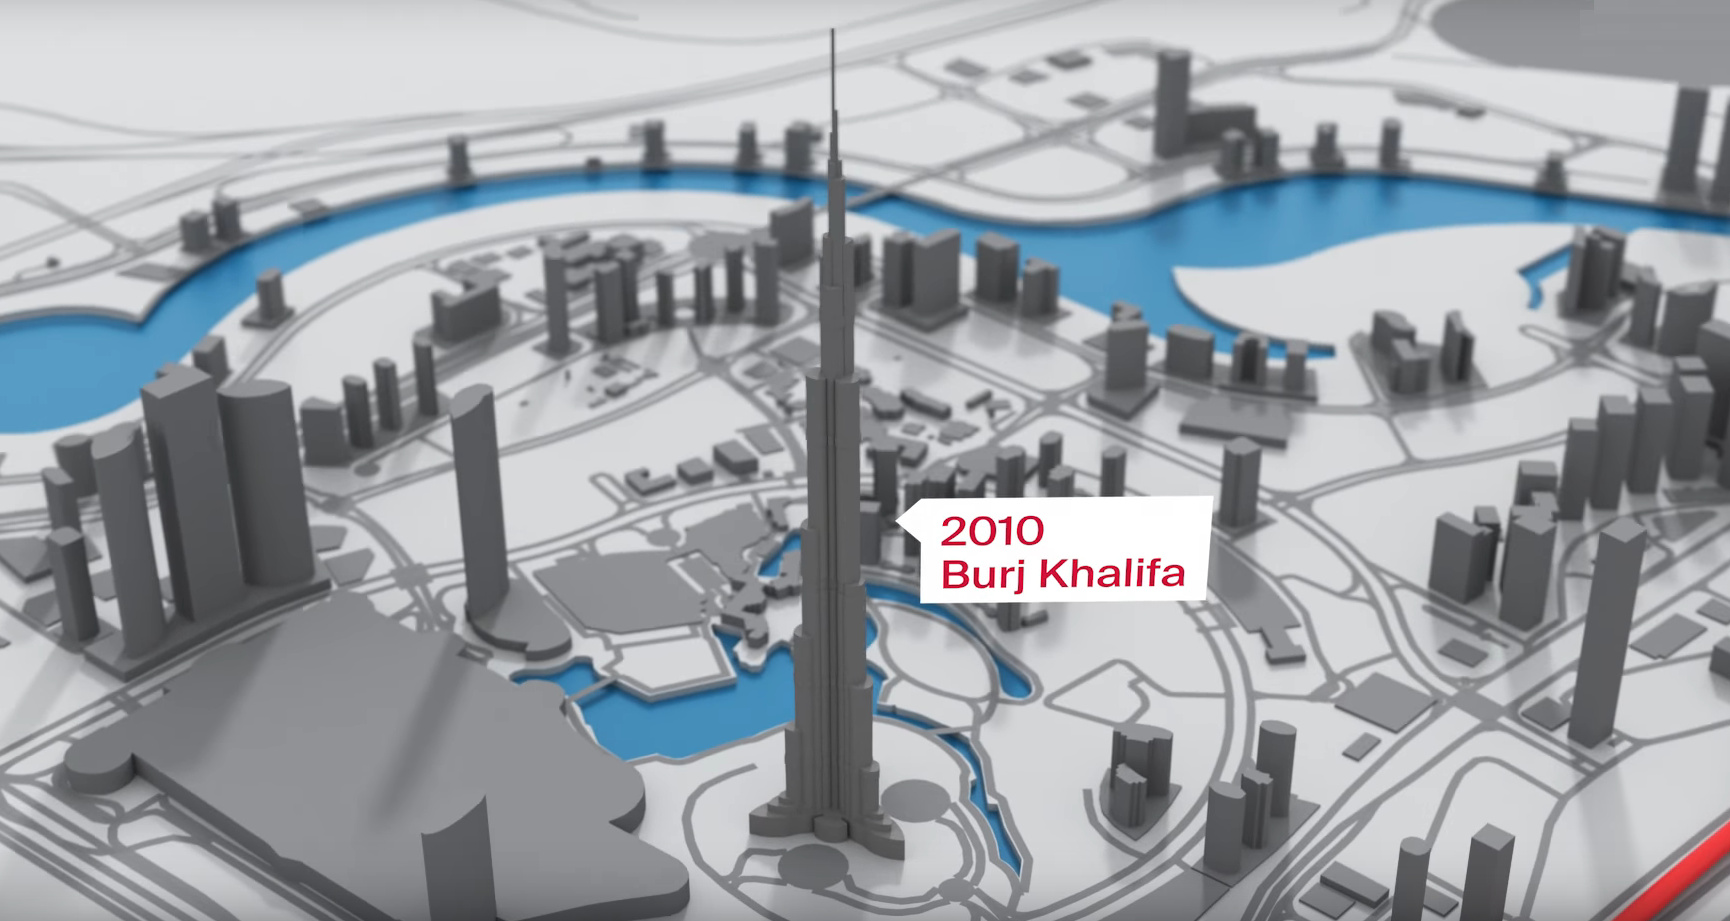
In just a half-century, Dubai has gone from a fishing village to a global real estate hub. Today's video and graphic track the city's stunning transformation.
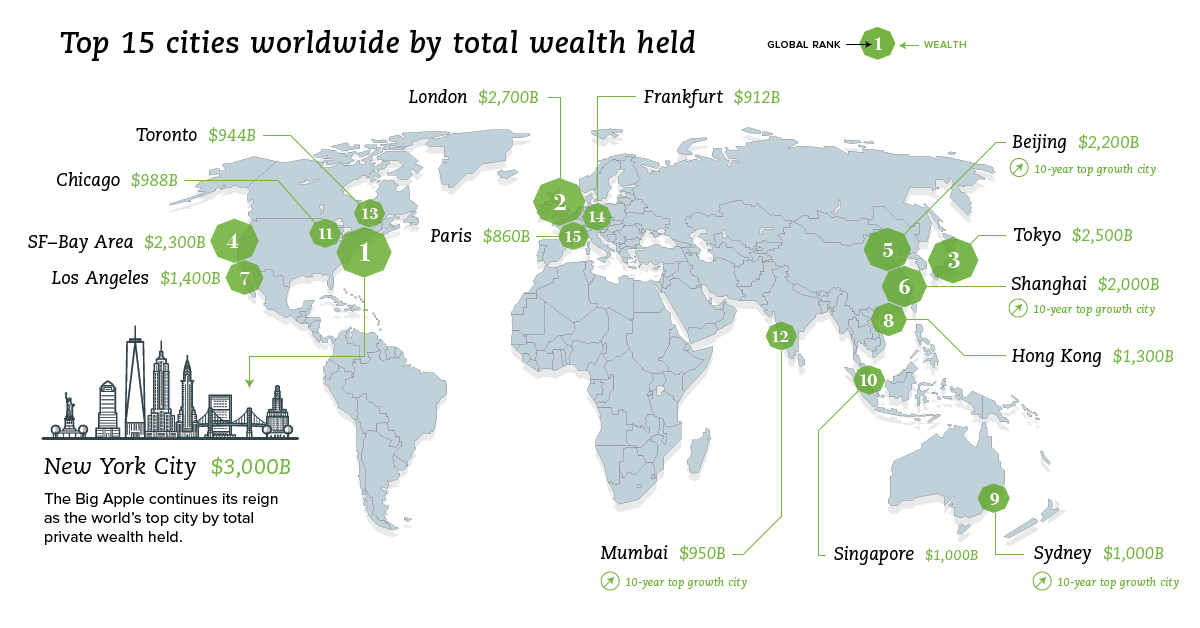
What are the world's wealthiest cities, and what portion of global wealth is located in each of these key urban centers?
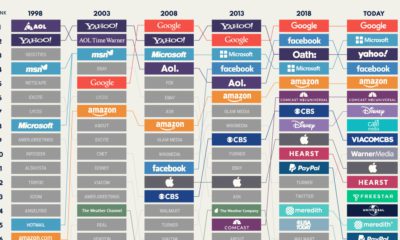
A lot has changed since Yahoo and AOL were the homepages of choice. This visualization looks at the largest internet giants in the U.S. since 1998.
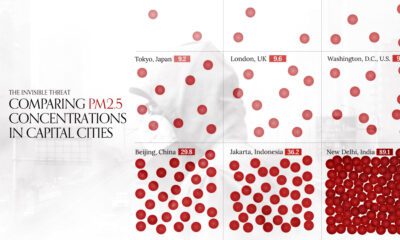
This visual compares air quality in 50 capital cities around the world by average PM2.5 concentrations in 2022.
Is owning a home still realistic? This map lays out the salary you'd need to buy a home in 50 different U.S. metro areas.
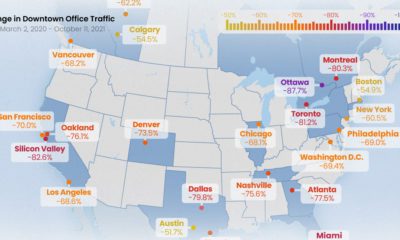
All North American downtowns are facing a sluggish recovery, but some are still seeing more than 80% less foot traffic than pre-pandemic times


 Creator Program