Which Retailers Operate in the Most Countries?
Mapped: The 10 U.S. States With the Lowest Real GDP Growth
Ranked: The World’s 50 Largest Private Equity Firms
Top 10 Countries Most in Debt to the IMF
Ranked: The Top 6 Economies by Share of Global GDP (1980-2024)
Ranked: The Top Startup Cities Around the World
Visualizing the 5 Most Common Cybersecurity Mistakes
Countries With the Highest Rates of Crypto Ownership
Mapped: The Number of AI Startups By Country
All of the Grants Given by the U.S. CHIPS Act
Mapped: The Income a Family Needs to Live Comfortably in Every U.S. State
Visualizing America’s Average Retirement Savings, by Age
Visualizing the Tax Burden of Every U.S. State
Charted: What Frustrates Americans About the Tax System
Visualizing Daily Protein Sources by Region
Mapped: Countries Where Recreational Cannabis is Legal
Which Countries Have the Highest Infant Mortality Rates?
Life Expectancy by Region (1950-2050F)
What Causes Preventable Child Deaths?
Ranked: The World’s Largest Lithium Producers in 2023
Who’s Building the Most Solar Energy?
Mapped: The Age of Energy Projects in Interconnection Queues, by State
Ranked: The Top 10 EV Battery Manufacturers in 2023
The World’s Biggest Nuclear Energy Producers
Mapped: The World’s Wettest and Driest Countries
Mapped: Indian States with Cities Over 1 Million People
Mapped: The Top Export in Each EU Country
The Biggest Salt Producing Countries in 2023
Visualizing Copper Production by Country in 2023
Where the World’s Aluminum is Smelted, by Country
Visualizing Global Gold Production in 2023
How People Get Around in America, Europe, and Asia
The Carbon Footprint of Major Travel Methods
Ranking the Top 15 Countries by Carbon Tax Revenue
Ranked: The Countries With the Most Air Pollution in 2023
Top Countries By Forest Growth Since 2001
The most important stories from the world of science and technology span topics including robotics, AI, genetics, space exploration, energy storage, and more.
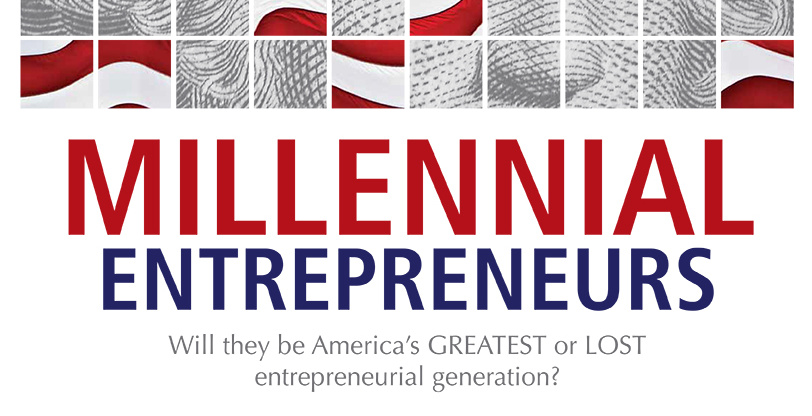
This infographic presents the data in the cases for millennial entrepreneurs as both the best and worst possible entrepreneurial generations.
We round up the most popular, most discussed, and most liked visualizations of the month on Voronoi, our new data storytelling platform.
We round up the most popular, most discussed, and most liked visualizations of the month on Voronoi, our new and free data storytelling platform.
See the most popular, most discussed, and most liked visualizations on our new data storytelling app Voronoi in December.
From Patagonia to TikTok, which brands are highly regarded in the eyes of Americans? This visual ranks the brand reputations of 100 companies.
Now, you can explore even more data-driven visualizations from the global talent in our newly launched Creator Program.
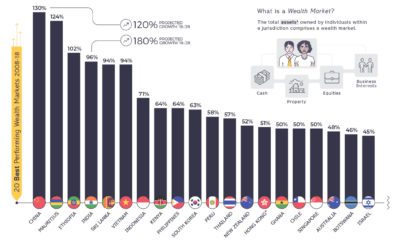
This telling chart shows how national wealth markets have changed over the past decade, highlighting the biggest winners and losers.
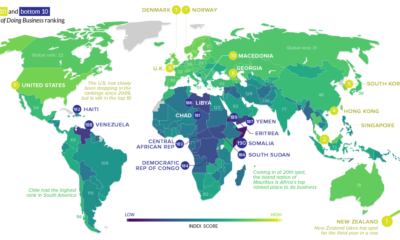
In some countries, launching a business is easy. In others? It's a hassle that is littered with bureaucracy, corruption, and a lack of basic services.