Mapped: The 10 U.S. States With the Lowest Real GDP Growth
Ranked: The World’s 50 Largest Private Equity Firms
Top 10 Countries Most in Debt to the IMF
Ranked: The Top 6 Economies by Share of Global GDP (1980-2024)
Mapped: Europe’s GDP Per Capita, by Country
Countries With the Highest Rates of Crypto Ownership
Mapped: The Number of AI Startups By Country
All of the Grants Given by the U.S. CHIPS Act
Visualizing AI Patents by Country
How Tech Logos Have Evolved Over Time
Visualizing America’s Average Retirement Savings, by Age
Visualizing the Tax Burden of Every U.S. State
Charted: What Frustrates Americans About the Tax System
Ranked: The Top 20 Countries in Debt to China
Mapped: Countries Where Recreational Cannabis is Legal
Which Countries Have the Highest Infant Mortality Rates?
Life Expectancy by Region (1950-2050F)
What Causes Preventable Child Deaths?
The Cost of an EpiPen in Major Markets
Who’s Building the Most Solar Energy?
Mapped: The Age of Energy Projects in Interconnection Queues, by State
Ranked: The Top 10 EV Battery Manufacturers in 2023
The World’s Biggest Nuclear Energy Producers
The World’s Biggest Oil Producers in 2023
Mapped: The Top Exports in Asian Countries
Mapped: U.S. States By Number of Cities Over 250,000 Residents
Mapped: U.S. Immigrants by Region
The Biggest Salt Producing Countries in 2023
Visualizing Copper Production by Country in 2023
Where the World’s Aluminum is Smelted, by Country
Visualizing Global Gold Production in 2023
How People Get Around in America, Europe, and Asia
The Carbon Footprint of Major Travel Methods
Ranking the Top 15 Countries by Carbon Tax Revenue
Ranked: The Countries With the Most Air Pollution in 2023
Top Countries By Forest Growth Since 2001
Which countries rank the highest in per capita carbon emissions, and how do they impact the world's total carbon emissions?
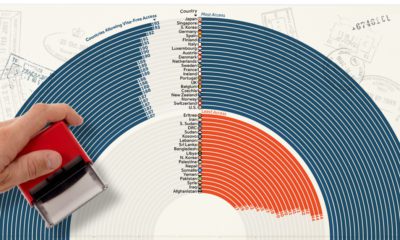
How strong is your passport? This ranking showcases the most and least powerful passports based on their ease of access to countries globally.
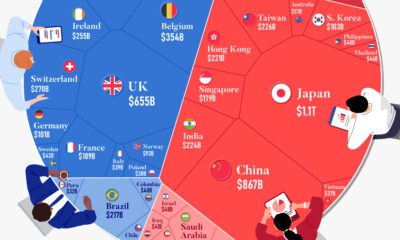
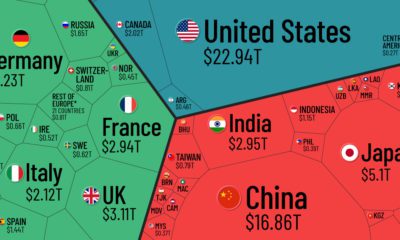
Which countries and regions contribute the most to the world economy? In this infographic, we break down all $94 trillion of global GDP by country.
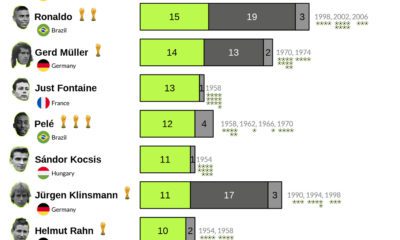
Who are history's top international goal scorers? These graphics highlight the players with the most goals scored in FIFA World Cup history.
Tracking Gallup survey data for more than a decade reveals insights into the regions seeing happiness gains.
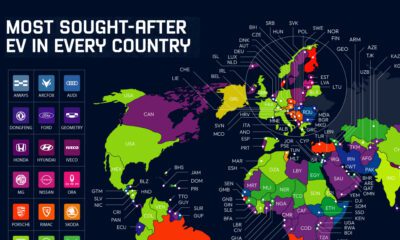
Industry stars, new entrants, and local models all populate this map of the most searched-for electric vehicles by country in 2022.
Foreign investors hold $7.3 trillion of the national U.S. debt. These holdings declined 6% in 2022 amid a strong U.S. dollar and rising rates.
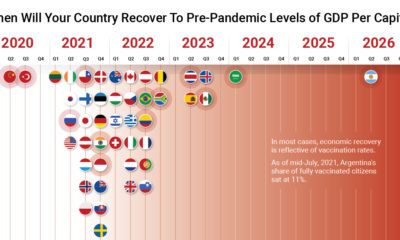
The path to COVID-19 recovery varies worldwide—some countries have already recovered, while others will not be back to normal for years.
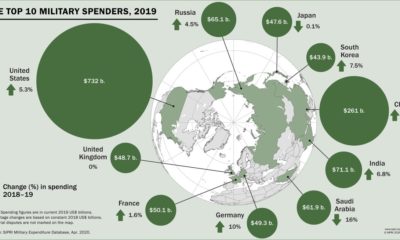
Global military spending surpassed $1.9 trillion in 2019, but nearly 75% of this total can be traced to just 10 countries.
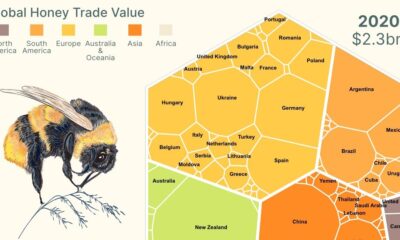
This infographic breaks down global honey exports and shows the power of Mānuka honey exports from New Zealand.


 Creator Program