Mapped: The 10 U.S. States With the Lowest Real GDP Growth
Ranked: The World’s 50 Largest Private Equity Firms
Top 10 Countries Most in Debt to the IMF
Ranked: The Top 6 Economies by Share of Global GDP (1980-2024)
Mapped: Europe’s GDP Per Capita, by Country
Ranked: The Top Startup Cities Around the World
Visualizing the 5 Most Common Cybersecurity Mistakes
Countries With the Highest Rates of Crypto Ownership
Mapped: The Number of AI Startups By Country
All of the Grants Given by the U.S. CHIPS Act
Visualizing America’s Average Retirement Savings, by Age
Visualizing the Tax Burden of Every U.S. State
Charted: What Frustrates Americans About the Tax System
Ranked: The Top 20 Countries in Debt to China
Mapped: Countries Where Recreational Cannabis is Legal
Which Countries Have the Highest Infant Mortality Rates?
Life Expectancy by Region (1950-2050F)
What Causes Preventable Child Deaths?
The Cost of an EpiPen in Major Markets
Who’s Building the Most Solar Energy?
Mapped: The Age of Energy Projects in Interconnection Queues, by State
Ranked: The Top 10 EV Battery Manufacturers in 2023
The World’s Biggest Nuclear Energy Producers
The World’s Biggest Oil Producers in 2023
Mapped: Indian States with Cities Over 1 Million People
Mapped: The Top Export in Each EU Country
Mapped: The Top Exports in Asian Countries
Mapped: U.S. States By Number of Cities Over 250,000 Residents
The Biggest Salt Producing Countries in 2023
Visualizing Copper Production by Country in 2023
Where the World’s Aluminum is Smelted, by Country
Visualizing Global Gold Production in 2023
How People Get Around in America, Europe, and Asia
The Carbon Footprint of Major Travel Methods
Ranking the Top 15 Countries by Carbon Tax Revenue
Ranked: The Countries With the Most Air Pollution in 2023
Top Countries By Forest Growth Since 2001
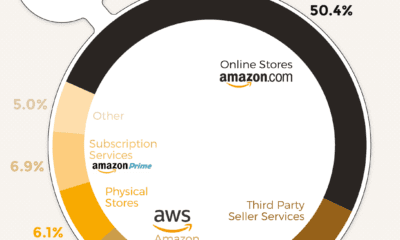
In 2019, Amazon generated $281 billion in total revenue—but where does all this revenue come from? Here’s a breakdown of how Amazon makes its money.
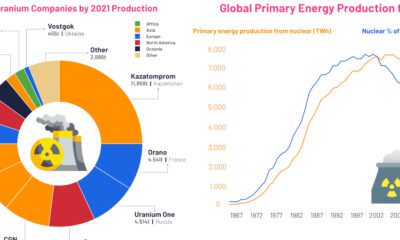
These visuals highlight the uranium mining industry and its output, as well as the trajectory of nuclear energy from 1960 to today.
Why is payments startup Stripe worth $9B? Partly, because it's made it so easy to tap into the backend, allowing the creation of a massive Stripe...
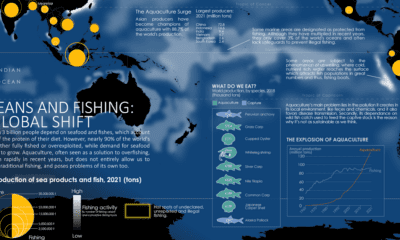
Where do our fish come from? This map charts ocean fishing activity and the amount of fish coming from aquaculture.
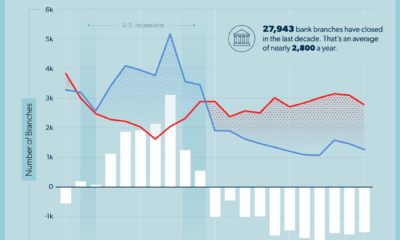
Over the last decade, U.S. bank locations have closed down at an alarming rate. Are we nearing the end of branch banking?
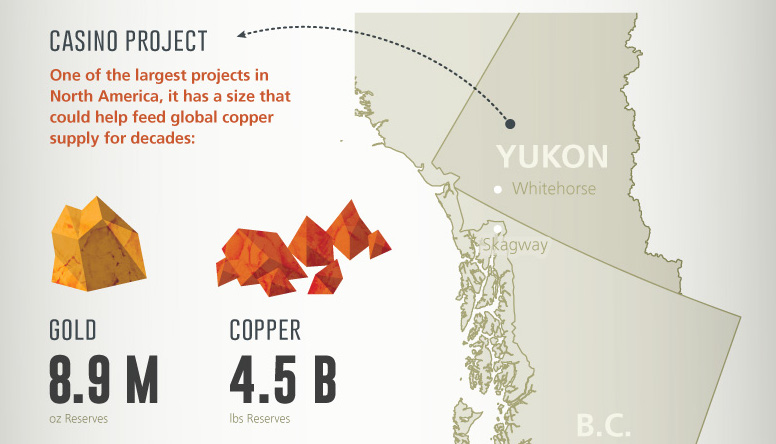
This company snapshot infographic highlights Western Copper and Gold, a company developing Canada's premiere copper and gold mine.
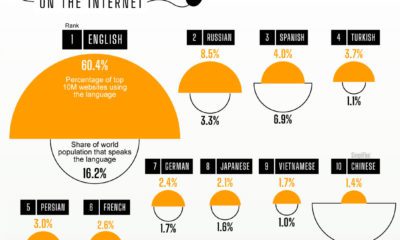
The internet is a truly global phenomenon, but a handful of languages dominate the digital world. Over 60% of the top 10 million webpages feature content...
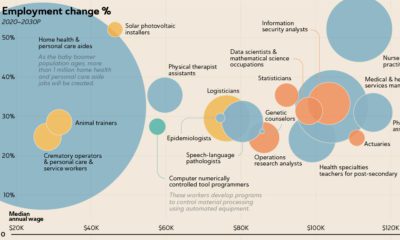
The U.S. Bureau of Labor Statistics predicts an overall job growth rate of 7.7%. Here, we show the fastest growing jobs and how much they pay.
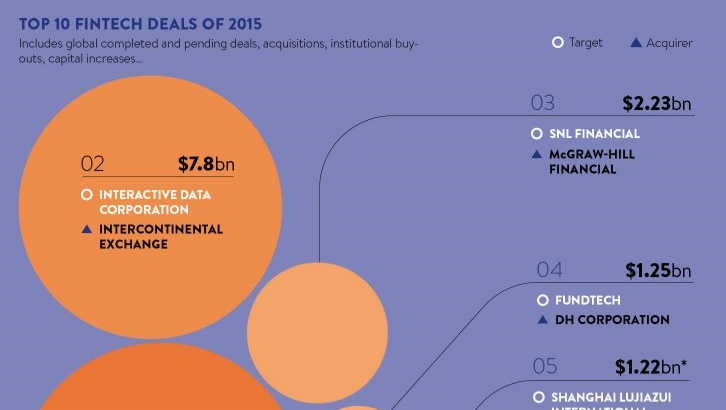
The fintech sector has been on fire lately. In today's infographic, we look back on the sector in 2015 to review the 10 biggest fintech deals...
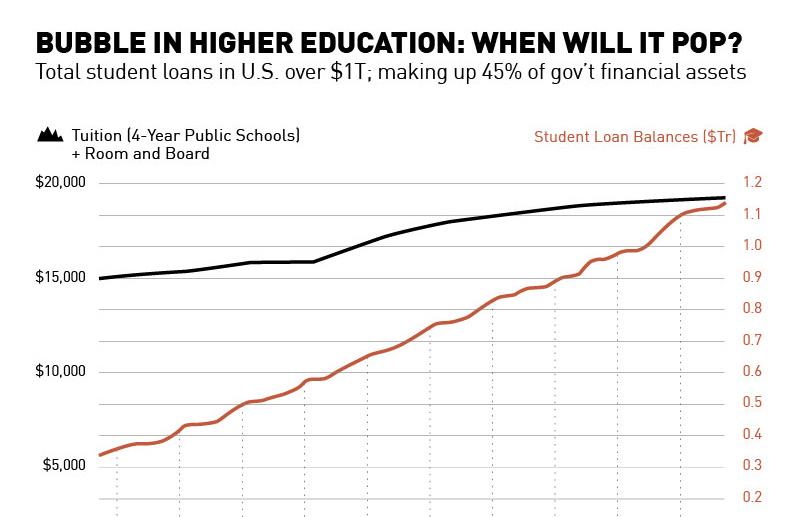
The bubble in higher education is starting to come to a head: student loan delinquencies are rising, the government is dominating the loan market, and colleges...


 Creator Program