Mapped: The 10 U.S. States With the Lowest Real GDP Growth
Ranked: The World’s 50 Largest Private Equity Firms
Top 10 Countries Most in Debt to the IMF
Ranked: The Top 6 Economies by Share of Global GDP (1980-2024)
Mapped: Europe’s GDP Per Capita, by Country
Countries With the Highest Rates of Crypto Ownership
Mapped: The Number of AI Startups By Country
All of the Grants Given by the U.S. CHIPS Act
Visualizing AI Patents by Country
How Tech Logos Have Evolved Over Time
Visualizing America’s Average Retirement Savings, by Age
Visualizing the Tax Burden of Every U.S. State
Charted: What Frustrates Americans About the Tax System
Ranked: The Top 20 Countries in Debt to China
Mapped: Countries Where Recreational Cannabis is Legal
Which Countries Have the Highest Infant Mortality Rates?
Life Expectancy by Region (1950-2050F)
What Causes Preventable Child Deaths?
The Cost of an EpiPen in Major Markets
Who’s Building the Most Solar Energy?
Mapped: The Age of Energy Projects in Interconnection Queues, by State
Ranked: The Top 10 EV Battery Manufacturers in 2023
The World’s Biggest Nuclear Energy Producers
The World’s Biggest Oil Producers in 2023
Mapped: The Top Exports in Asian Countries
Mapped: U.S. States By Number of Cities Over 250,000 Residents
Mapped: U.S. Immigrants by Region
The Biggest Salt Producing Countries in 2023
Visualizing Copper Production by Country in 2023
Where the World’s Aluminum is Smelted, by Country
Visualizing Global Gold Production in 2023
How People Get Around in America, Europe, and Asia
The Carbon Footprint of Major Travel Methods
Ranking the Top 15 Countries by Carbon Tax Revenue
Ranked: The Countries With the Most Air Pollution in 2023
Top Countries By Forest Growth Since 2001
In this visual, we've ranked the top U.S. metropolitan areas in terms of their GDP. How does your city rank?
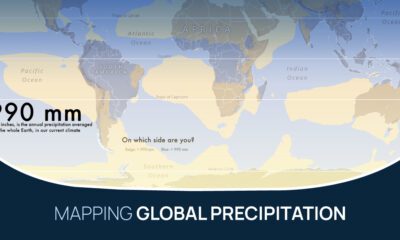
What does the global precipitation map look like if we split it in two, one half with below average rainfall and the other above?
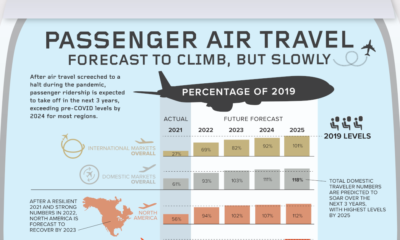
COVID-19 hit the air travel industry hard. But passenger traffic is slowly recovering, and by 2025, things are expected to return to 'normal.'
This interesting graphic gives an overview of the world’s most popular—and the highest paid—YouTubers in 187 different countries.
This chart highlights the different countries, and the number of people, facing water security issues around the world.
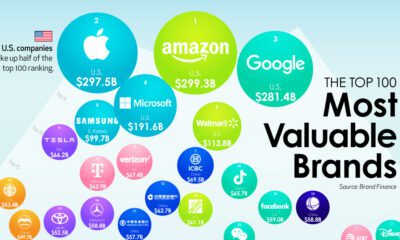
We show the top companies by brand value—and the brands that are rising the fastest as consumer expectations shift.
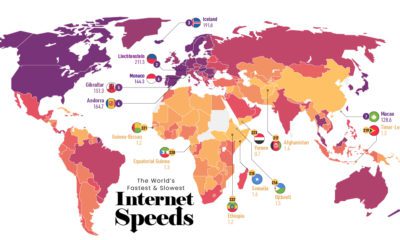
Internet speeds vary depending on your location. Here’s a look at the countries with the fastest—and slowest—internet speeds worldwide.
The history of Europe is breathtakingly complex, but this animation helps makes sense of 2,400 years of change on the European map.
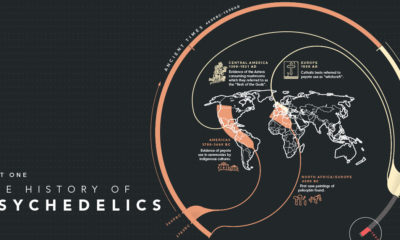
This graphic is part one in a series that showcases the 6,000-year history of psychedelics, from ancient antidote to breakthrough therapies.
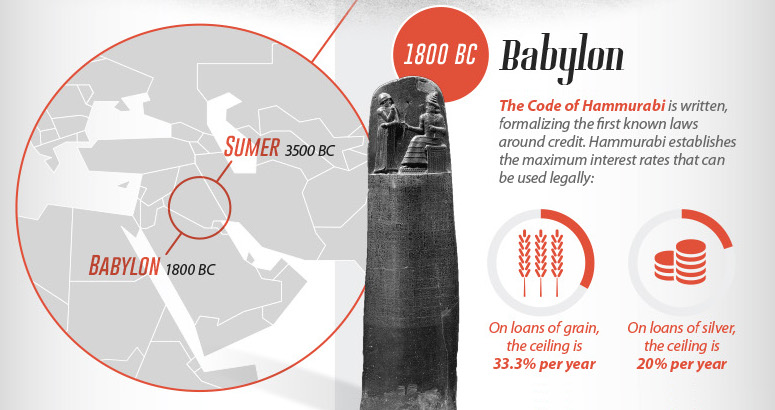
From the writings of antiquity to the innovations that fueled the modern debt boom, we look at the history of consumer credit in this massive infographic.


 Creator Program