Which Retailers Operate in the Most Countries?
Mapped: The 10 U.S. States With the Lowest Real GDP Growth
Ranked: The World’s 50 Largest Private Equity Firms
Top 10 Countries Most in Debt to the IMF
Ranked: The Top 6 Economies by Share of Global GDP (1980-2024)
Ranked: The Top Startup Cities Around the World
Visualizing the 5 Most Common Cybersecurity Mistakes
Countries With the Highest Rates of Crypto Ownership
Mapped: The Number of AI Startups By Country
All of the Grants Given by the U.S. CHIPS Act
Mapped: The Income a Family Needs to Live Comfortably in Every U.S. State
Visualizing America’s Average Retirement Savings, by Age
Visualizing the Tax Burden of Every U.S. State
Charted: What Frustrates Americans About the Tax System
Mapped: Countries Where Recreational Cannabis is Legal
Which Countries Have the Highest Infant Mortality Rates?
Life Expectancy by Region (1950-2050F)
What Causes Preventable Child Deaths?
The Cost of an EpiPen in Major Markets
Ranked: The World’s Largest Lithium Producers in 2023
Who’s Building the Most Solar Energy?
Mapped: The Age of Energy Projects in Interconnection Queues, by State
Ranked: The Top 10 EV Battery Manufacturers in 2023
The World’s Biggest Nuclear Energy Producers
Mapped: The World’s Wettest and Driest Countries
Mapped: Indian States with Cities Over 1 Million People
Mapped: The Top Export in Each EU Country
The Biggest Salt Producing Countries in 2023
Visualizing Copper Production by Country in 2023
Where the World’s Aluminum is Smelted, by Country
Visualizing Global Gold Production in 2023
How People Get Around in America, Europe, and Asia
The Carbon Footprint of Major Travel Methods
Ranking the Top 15 Countries by Carbon Tax Revenue
Ranked: The Countries With the Most Air Pollution in 2023
Top Countries By Forest Growth Since 2001
This infographic examines trends in each generation's media consumption to see how Americans adapted during the pandemic.
This month, we dive into bonus content from our new Generational Power Index, as well as topical visualizations in the news.
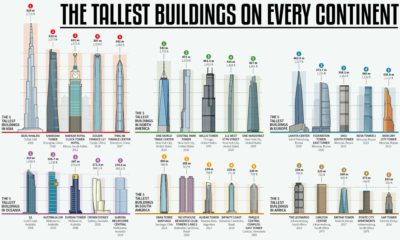
How much higher and further into the skies can we reach? This infographic looks at the most impressive skyscrapers gracing every continent.
This chart looks at some of the common items that are sold on the Dark Web, and how much they sold for on average in 2022.
The continuation of our story on Germany's bout with hyperinflation in the early 1920s. We look at the effects, as well as even worse stories of...
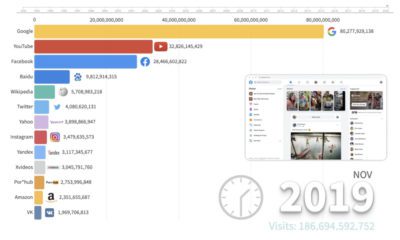
This animation provides an interesting overview of the websites with the highest traffic over the last few decades, and how the rankings have changed.
Find out how to get access to a list of our greatest visualizations of all time. Opportunity ends July 1st, 2022.
How new media has ushered in a better experience for investors. Welcome to the modern era of investor relations.
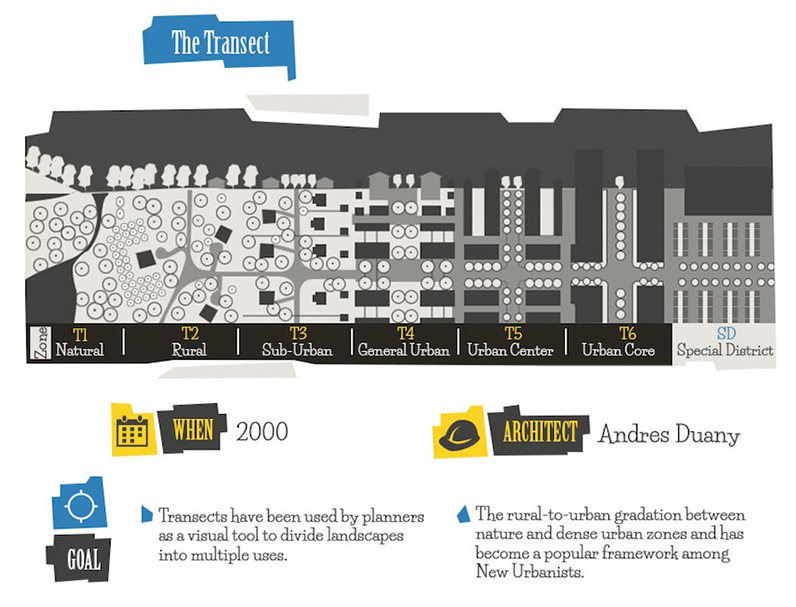
From garden cities to psychogeography, the 20th century saw a number of bold ideas that radically changed urban planning.
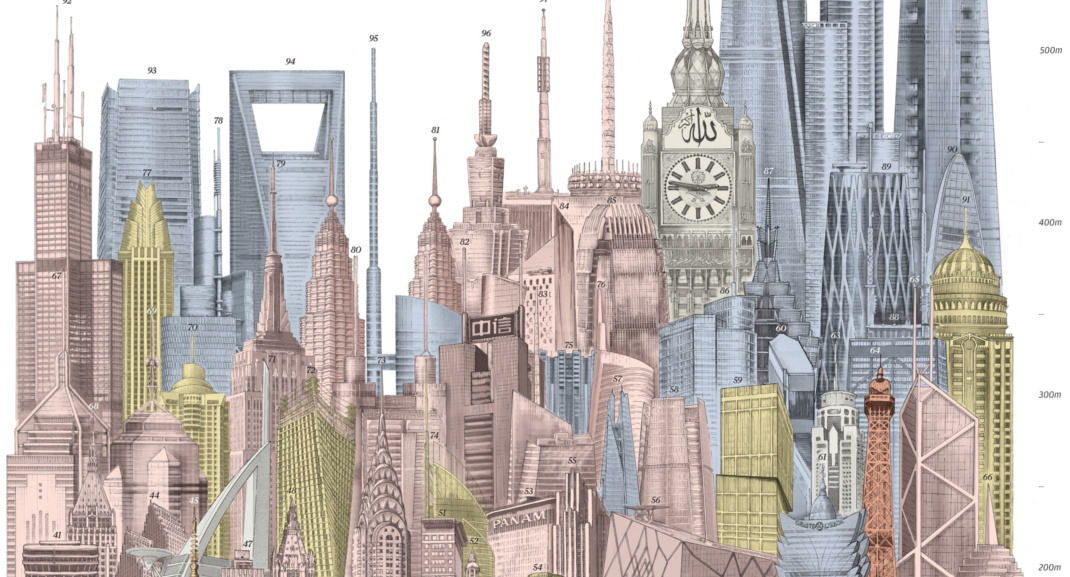
Today's visualization demonstrates the mind-bending scale of the newest generation of megatall skyscrapers. The stage is set for a global skyscraper boom.


 Creator Program