Mapped: The 10 U.S. States With the Lowest Real GDP Growth
Ranked: The World’s 50 Largest Private Equity Firms
Top 10 Countries Most in Debt to the IMF
Ranked: The Top 6 Economies by Share of Global GDP (1980-2024)
Mapped: Europe’s GDP Per Capita, by Country
Countries With the Highest Rates of Crypto Ownership
Mapped: The Number of AI Startups By Country
All of the Grants Given by the U.S. CHIPS Act
Visualizing AI Patents by Country
How Tech Logos Have Evolved Over Time
Visualizing America’s Average Retirement Savings, by Age
Visualizing the Tax Burden of Every U.S. State
Charted: What Frustrates Americans About the Tax System
Ranked: The Top 20 Countries in Debt to China
Mapped: Countries Where Recreational Cannabis is Legal
Which Countries Have the Highest Infant Mortality Rates?
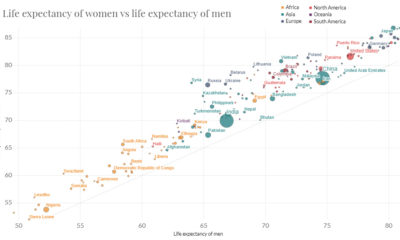
Life Expectancy by Region (1950-2050F)
What Causes Preventable Child Deaths?
The Cost of an EpiPen in Major Markets
Who’s Building the Most Solar Energy?
Mapped: The Age of Energy Projects in Interconnection Queues, by State
Ranked: The Top 10 EV Battery Manufacturers in 2023
The World’s Biggest Nuclear Energy Producers
The World’s Biggest Oil Producers in 2023
Mapped: The Top Exports in Asian Countries
Mapped: U.S. States By Number of Cities Over 250,000 Residents
Mapped: U.S. Immigrants by Region
The Biggest Salt Producing Countries in 2023
Visualizing Copper Production by Country in 2023
Where the World’s Aluminum is Smelted, by Country
Visualizing Global Gold Production in 2023
How People Get Around in America, Europe, and Asia
The Carbon Footprint of Major Travel Methods
Ranking the Top 15 Countries by Carbon Tax Revenue
Ranked: The Countries With the Most Air Pollution in 2023
Top Countries By Forest Growth Since 2001
This infographic examines trends in each generation's media consumption to see how Americans adapted during the pandemic.
In just 65 years, global life expectancy has skyrocketed. See its ascent in this short animation, or dive into the interactive version for more data.
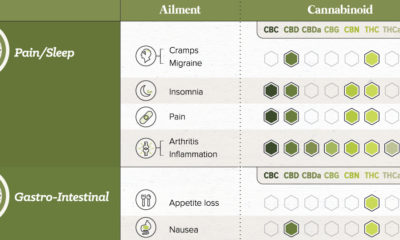
A deep-dive into the science behind the medical cannabis industry can provide some investor insight into what makes it a multi-billion dollar market.
Unfortunately, fighting fake news may mean taking away the things that make the internet so great in the first place.
This chart looks at some of the common items that are sold on the Dark Web, and how much they sold for on average in 2022.
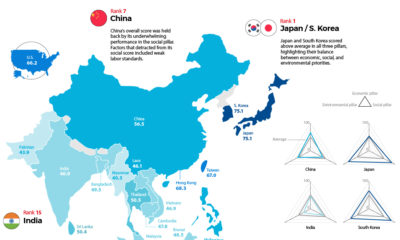
The Sustainable Trade Index ranks 19 Asian economies and the U.S. across three categories of trade sustainability.
The continuation of our story on Germany's bout with hyperinflation in the early 1920s. We look at the effects, as well as even worse stories of...
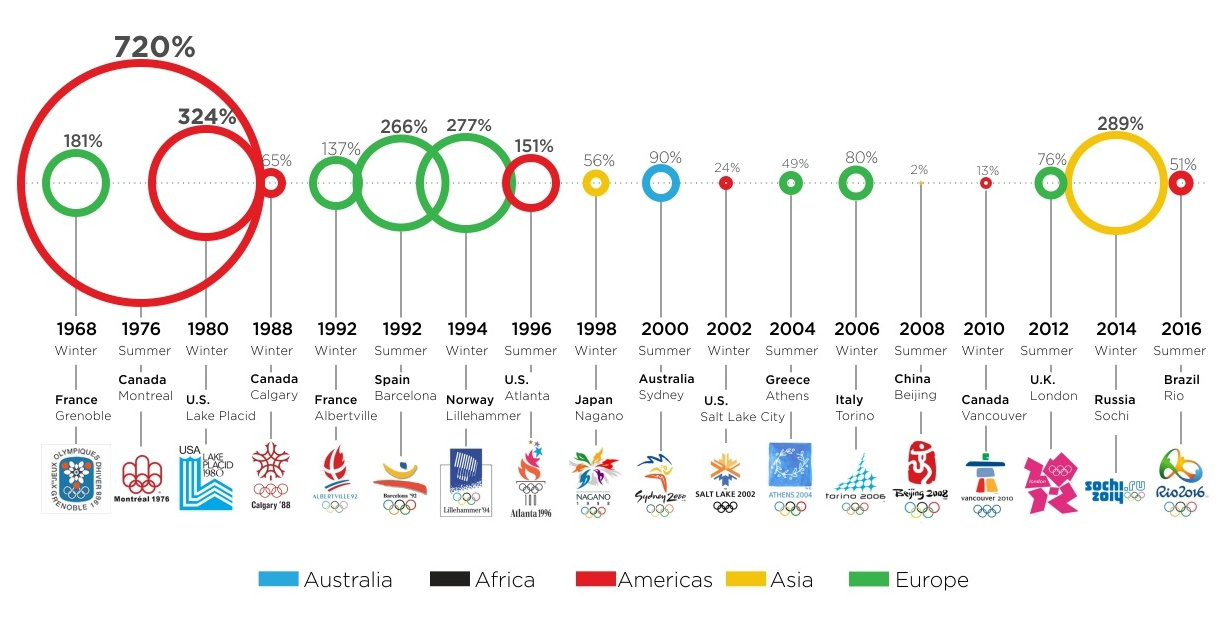
Rarely can a 51% cost overrun be called a success. It turns out, in the bizarro world of the Olympics, going that far overbudget actually isn't...
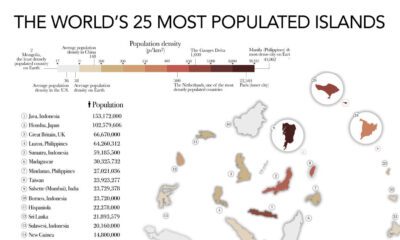
The most populated islands of the earth are teeming hubs of human activity, a far cry from the remote paradises in popular imaginations.
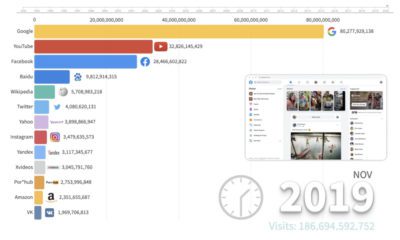
This animation provides an interesting overview of the websites with the highest traffic over the last few decades, and how the rankings have changed.


 Creator Program