Mapped: The 10 U.S. States With the Lowest Real GDP Growth
Ranked: The World’s 50 Largest Private Equity Firms
Top 10 Countries Most in Debt to the IMF
Ranked: The Top 6 Economies by Share of Global GDP (1980-2024)
Mapped: Europe’s GDP Per Capita, by Country
Countries With the Highest Rates of Crypto Ownership
Mapped: The Number of AI Startups By Country
All of the Grants Given by the U.S. CHIPS Act
Visualizing AI Patents by Country
How Tech Logos Have Evolved Over Time
Visualizing America’s Average Retirement Savings, by Age
Visualizing the Tax Burden of Every U.S. State
Charted: What Frustrates Americans About the Tax System
Ranked: The Top 20 Countries in Debt to China
Mapped: Countries Where Recreational Cannabis is Legal
Which Countries Have the Highest Infant Mortality Rates?
Life Expectancy by Region (1950-2050F)
What Causes Preventable Child Deaths?
The Cost of an EpiPen in Major Markets
Who’s Building the Most Solar Energy?
Mapped: The Age of Energy Projects in Interconnection Queues, by State
Ranked: The Top 10 EV Battery Manufacturers in 2023
The World’s Biggest Nuclear Energy Producers
The World’s Biggest Oil Producers in 2023
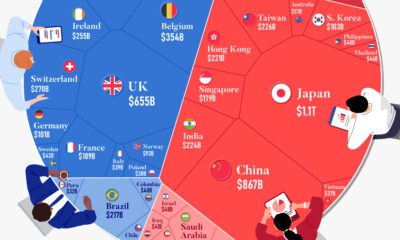
Mapped: The Top Exports in Asian Countries
Mapped: U.S. States By Number of Cities Over 250,000 Residents
Mapped: U.S. Immigrants by Region
The Biggest Salt Producing Countries in 2023
Visualizing Copper Production by Country in 2023
Where the World’s Aluminum is Smelted, by Country
Visualizing Global Gold Production in 2023
How People Get Around in America, Europe, and Asia
The Carbon Footprint of Major Travel Methods
Ranking the Top 15 Countries by Carbon Tax Revenue
Ranked: The Countries With the Most Air Pollution in 2023
Top Countries By Forest Growth Since 2001
Analyzing 2023 per capita GDP numbers from the International Monetary Fund lets us know where the richest countries in the world are.
Analyzing 2023 per capita GDP numbers from the International Monetary Fund lets us know where the poorest countries are.
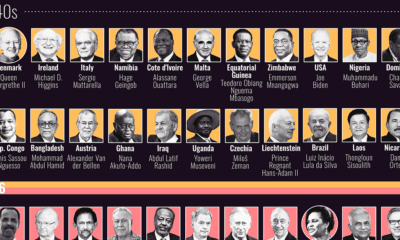
This graphic visualizes the ages of every country’s head of state, and compares them with the median population of their respective states.
Foreign investors hold $7.3 trillion of the national U.S. debt. These holdings declined 6% in 2022 amid a strong U.S. dollar and rising rates.
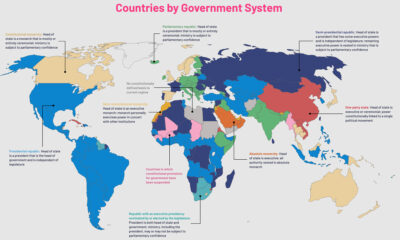
The political regimes of the world's countries have changed over centuries. This map charts the nine government systems that rule the world today.
Where do the happiest people on earth live? This map is a snapshot of the world's most (and least) happy countries in 2023.
This infographic shows the net minimum wage across 67 countries, as of January 2023. A breakdown by U.S. state is also included.
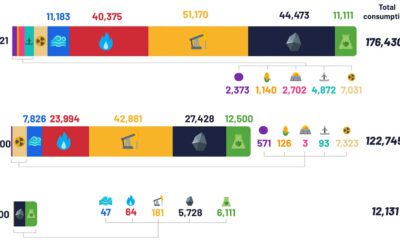
Despite the advent of renewable sources of energy, fossil fuels and their carbon emissions, haven’t gone anywhere.
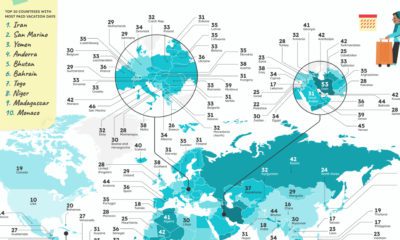
Which countries have the most vacation days, or the most public holidays? These graphics reveal how many paid vacation days each country mandates.
Just four economies around the world had inflation below 2% in 2022. We show the countries with the lowest inflation globally.


 Creator Program