Mapped: The 10 U.S. States With the Lowest Real GDP Growth
Ranked: The World’s 50 Largest Private Equity Firms
Top 10 Countries Most in Debt to the IMF
Ranked: The Top 6 Economies by Share of Global GDP (1980-2024)
Mapped: Europe’s GDP Per Capita, by Country
Countries With the Highest Rates of Crypto Ownership
Mapped: The Number of AI Startups By Country
All of the Grants Given by the U.S. CHIPS Act
Visualizing AI Patents by Country
How Tech Logos Have Evolved Over Time
Visualizing America’s Average Retirement Savings, by Age
Visualizing the Tax Burden of Every U.S. State
Charted: What Frustrates Americans About the Tax System
Ranked: The Top 20 Countries in Debt to China
Mapped: Countries Where Recreational Cannabis is Legal
Which Countries Have the Highest Infant Mortality Rates?
Life Expectancy by Region (1950-2050F)
What Causes Preventable Child Deaths?
The Cost of an EpiPen in Major Markets
Who’s Building the Most Solar Energy?
Mapped: The Age of Energy Projects in Interconnection Queues, by State
Ranked: The Top 10 EV Battery Manufacturers in 2023
The World’s Biggest Nuclear Energy Producers
The World’s Biggest Oil Producers in 2023
Mapped: The Top Exports in Asian Countries
Mapped: U.S. States By Number of Cities Over 250,000 Residents
Mapped: U.S. Immigrants by Region
The Biggest Salt Producing Countries in 2023
Visualizing Copper Production by Country in 2023
Where the World’s Aluminum is Smelted, by Country
Visualizing Global Gold Production in 2023
How People Get Around in America, Europe, and Asia
The Carbon Footprint of Major Travel Methods
Ranking the Top 15 Countries by Carbon Tax Revenue
Ranked: The Countries With the Most Air Pollution in 2023
Top Countries By Forest Growth Since 2001
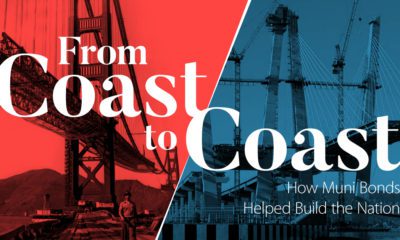
From the Erie Canal to the Golden Gate Bridge, U.S. municipal bonds have financed crucial infrastructure. This infographic details their long history.
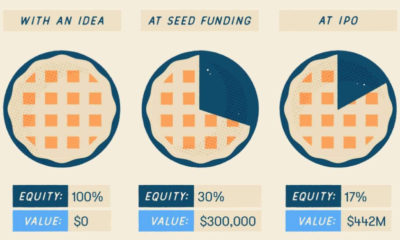
About 1,500 companies are founded daily, but how does the typical startup get financed? This creative graphic uses pie to explain startup funding rounds.
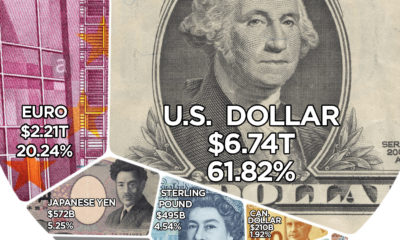
Here are the reserve currencies that the world's central banks hold onto for a rainy day.
This infographic explores how China’s proposed social credit system will monitor and surveil citizens, and how it'll be used to reward or punish them.
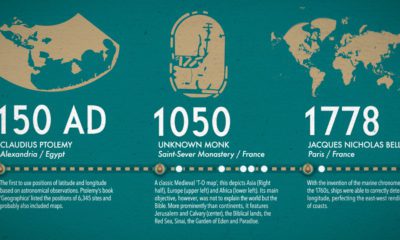
What did ancient maps look like, before we had access to airplanes and satellites? See the evolution of the world map in this nifty infographic.
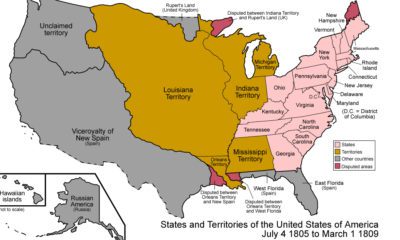
From the Thirteen Colonies to present-day USA, this animation is a detailed look at how borders have shifted throughout the nation's history.
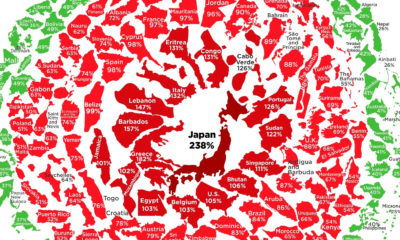
See the latest levels of government debt, based on the IMF's most recent data. Where does your country sit in the snowball?
The blockchain is already well-known for its disruptive potential in financial applications, but it's actual impact will be much more far-reaching beyond that.
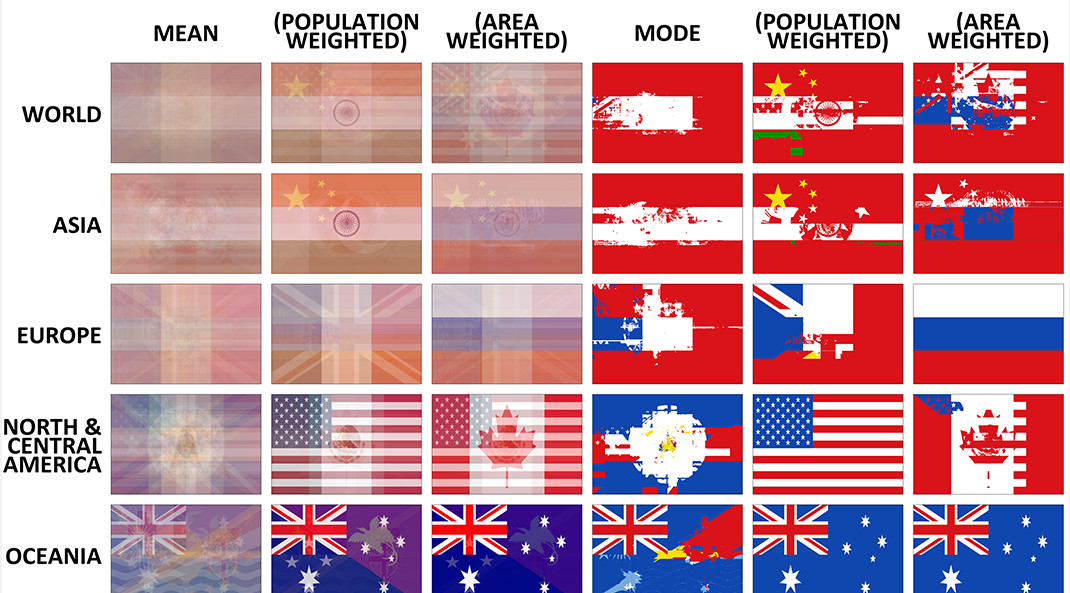
The average flag of the world, as well as different continents, if every flag were combined together. Also, a look at the building blocks of flag...
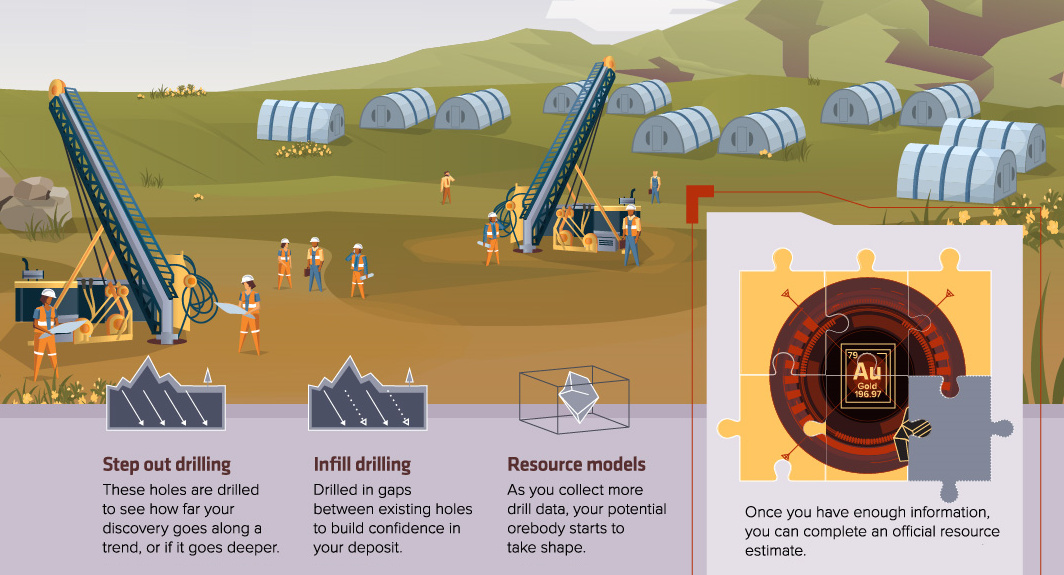
Finding a new deposit is tough, but here's how to better your odds. This infographic shows the steps of mineral exploration, from prospecting to production.