Top 10 Countries Most in Debt to the IMF
Ranked: The Top 6 Economies by Share of Global GDP (1980-2024)
Mapped: Europe’s GDP Per Capita, by Country
The Growth of a $1,000 Equity Investment, by Stock Market
Mapped: The Most Valuable Company in Each Southeast Asian Country
Countries With the Highest Rates of Crypto Ownership
Mapped: The Number of AI Startups By Country
All of the Grants Given by the U.S. CHIPS Act
Visualizing AI Patents by Country
How Tech Logos Have Evolved Over Time
Visualizing America’s Average Retirement Savings, by Age
Visualizing the Tax Burden of Every U.S. State
Charted: What Frustrates Americans About the Tax System
Ranked: The Top 20 Countries in Debt to China
Mapped: Countries Where Recreational Cannabis is Legal
Which Countries Have the Highest Infant Mortality Rates?
Life Expectancy by Region (1950-2050F)
What Causes Preventable Child Deaths?
The Cost of an EpiPen in Major Markets
Who’s Building the Most Solar Energy?
Mapped: The Age of Energy Projects in Interconnection Queues, by State
Ranked: The Top 10 EV Battery Manufacturers in 2023
The World’s Biggest Nuclear Energy Producers
The World’s Biggest Oil Producers in 2023
Mapped: U.S. States By Number of Cities Over 250,000 Residents
Mapped: U.S. Immigrants by Region
Mapped: Southeast Asia’s GDP Per Capita, by Country
The Largest Earthquakes in the New York Area (1970-2024)
The Biggest Salt Producing Countries in 2023
Visualizing Copper Production by Country in 2023
Where the World’s Aluminum is Smelted, by Country
Visualizing Global Gold Production in 2023
How People Get Around in America, Europe, and Asia
The Carbon Footprint of Major Travel Methods
Ranking the Top 15 Countries by Carbon Tax Revenue
Ranked: The Countries With the Most Air Pollution in 2023
Top Countries By Forest Growth Since 2001
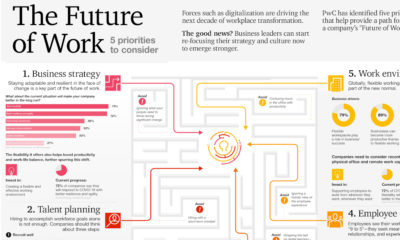
Five Business Priorities for the Future of Work View a high resolution version of this graphic by clicking here. COVID-19 is ushering in an entirely different...
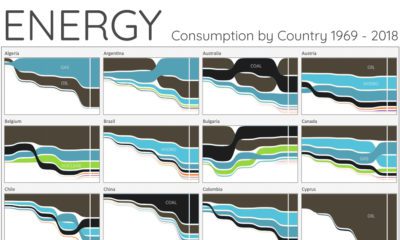
For the last 50 years, fossil fuels have dominated energy consumption. This chart looks at how the energy mix is changing in over 60+ countries.
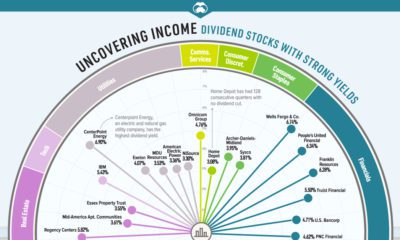
Some companies are cutting or suspending dividends. Which dividend stocks can investors consider for stable distributions and strong yields?
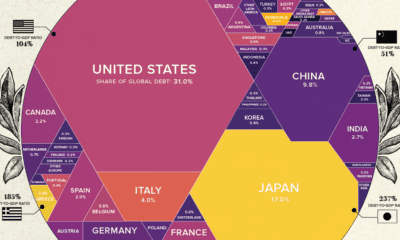
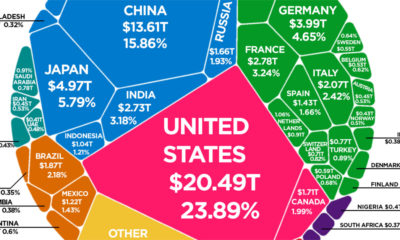
What share of government world debt does each country owe? See it all broken down in this stunning visualization.
According to the latest World Bank data, the global economy is now $85.8 trillion in nominal terms. Here's how it breaks down.
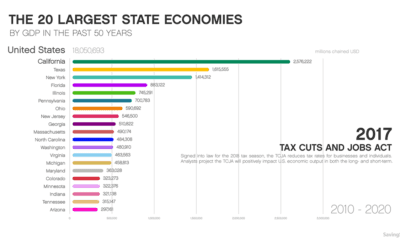
This animation shows how the largest state economies by GDP have changed over the last five decades of time, and what such a ranking looks like...
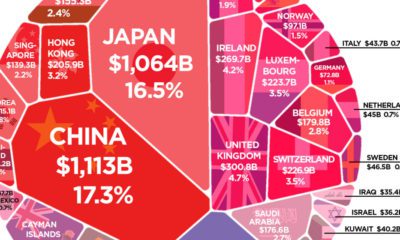
More than $6 trillion of U.S. debt is owned by foreign governments such as China or Japan. See how it all breaks down, and what it...
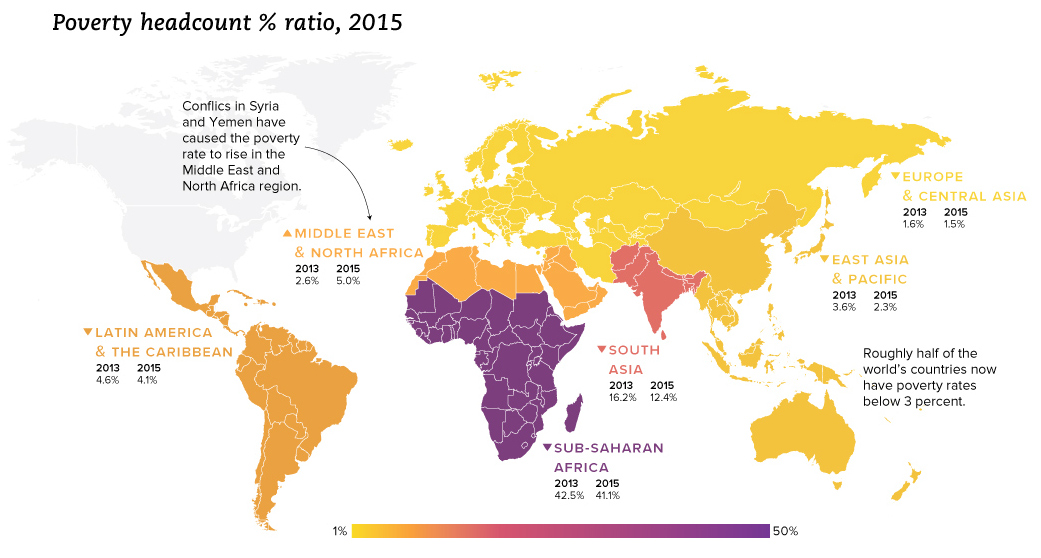
We look at the latest data from the World Bank, which reveals a drop in extreme poverty of 1 billion people globally since the year 1990.
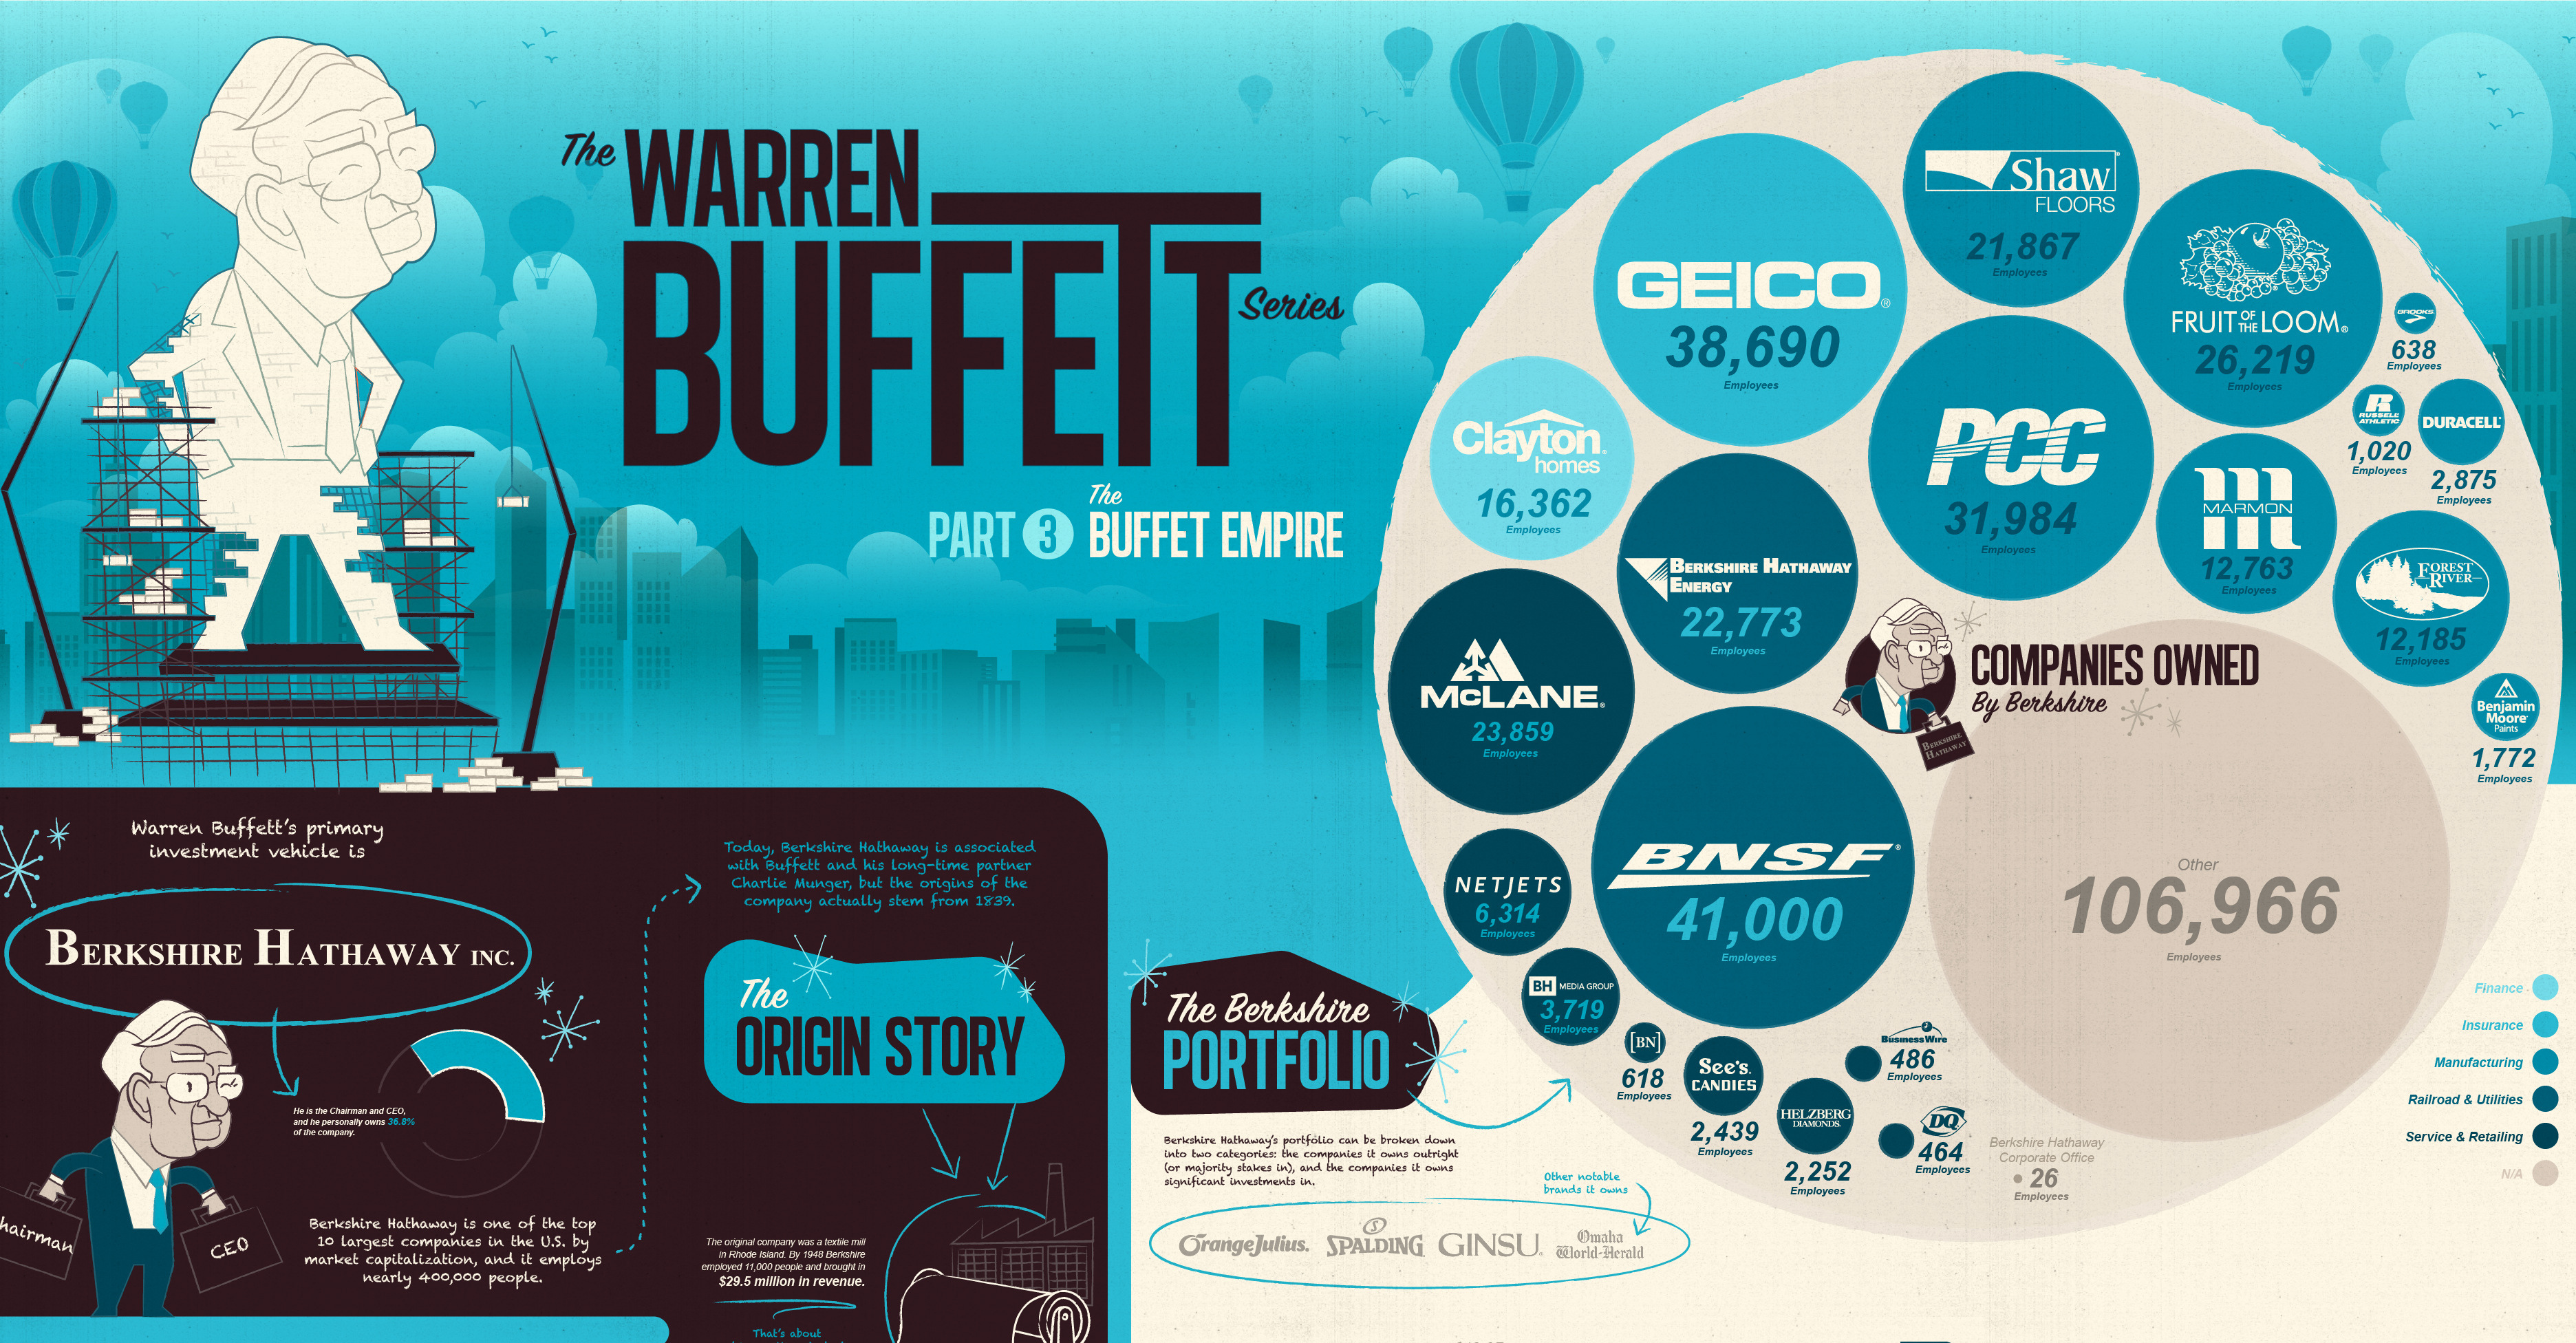
View the extent of the Warren Buffett Empire in this massive infographic, which shows the many, many household companies Berkshire Hathaway owns and controls.
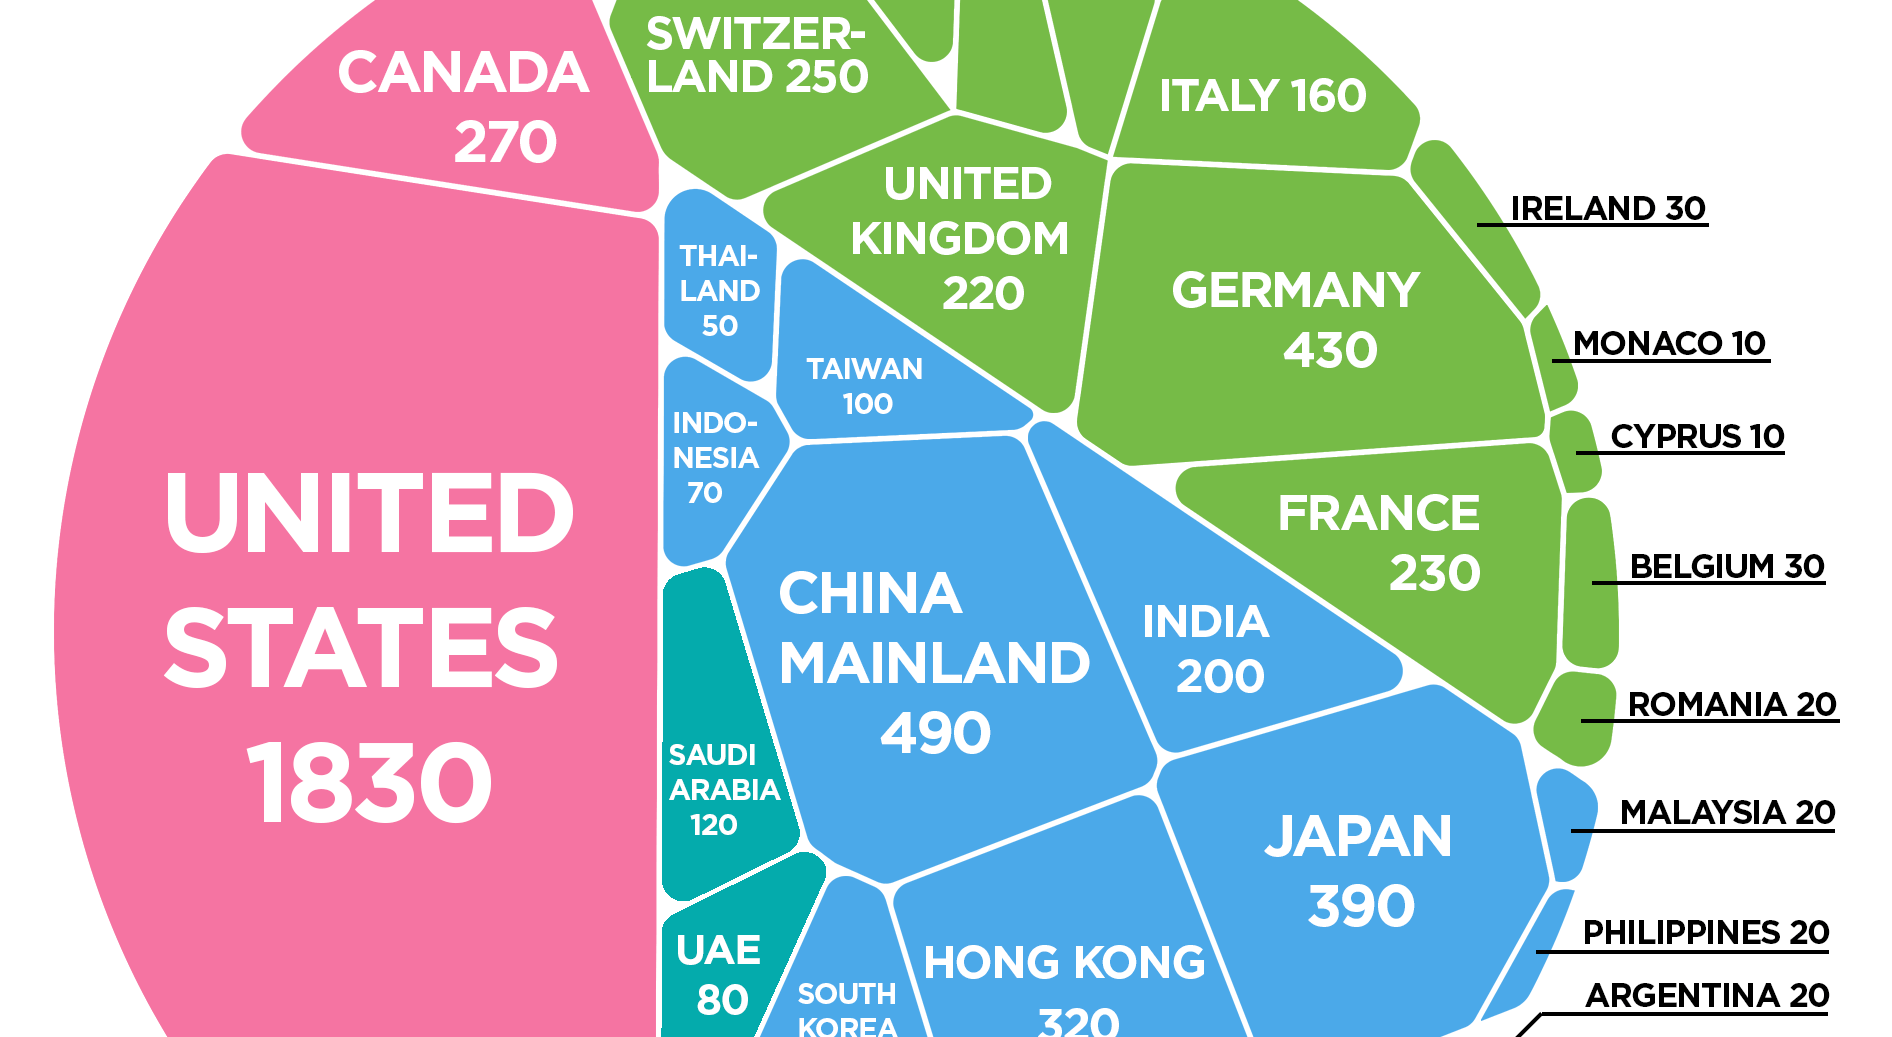
How many ultra rich people live in each country and continent? This chart shows the amount of people with fortunes exceeding $500 million in each place.