Mapped: The 10 U.S. States With the Lowest Real GDP Growth
Ranked: The World’s 50 Largest Private Equity Firms
Top 10 Countries Most in Debt to the IMF
Ranked: The Top 6 Economies by Share of Global GDP (1980-2024)
Mapped: Europe’s GDP Per Capita, by Country
Countries With the Highest Rates of Crypto Ownership
Mapped: The Number of AI Startups By Country
All of the Grants Given by the U.S. CHIPS Act
Visualizing AI Patents by Country
How Tech Logos Have Evolved Over Time
Visualizing America’s Average Retirement Savings, by Age
Visualizing the Tax Burden of Every U.S. State
Charted: What Frustrates Americans About the Tax System
Ranked: The Top 20 Countries in Debt to China
Mapped: Countries Where Recreational Cannabis is Legal
Which Countries Have the Highest Infant Mortality Rates?
Life Expectancy by Region (1950-2050F)
What Causes Preventable Child Deaths?
The Cost of an EpiPen in Major Markets
Who’s Building the Most Solar Energy?
Mapped: The Age of Energy Projects in Interconnection Queues, by State
Ranked: The Top 10 EV Battery Manufacturers in 2023
The World’s Biggest Nuclear Energy Producers
The World’s Biggest Oil Producers in 2023
Mapped: The Top Exports in Asian Countries
Mapped: U.S. States By Number of Cities Over 250,000 Residents
Mapped: U.S. Immigrants by Region
The Biggest Salt Producing Countries in 2023
Visualizing Copper Production by Country in 2023
Where the World’s Aluminum is Smelted, by Country
Visualizing Global Gold Production in 2023
How People Get Around in America, Europe, and Asia
The Carbon Footprint of Major Travel Methods
Ranking the Top 15 Countries by Carbon Tax Revenue
Ranked: The Countries With the Most Air Pollution in 2023
Top Countries By Forest Growth Since 2001
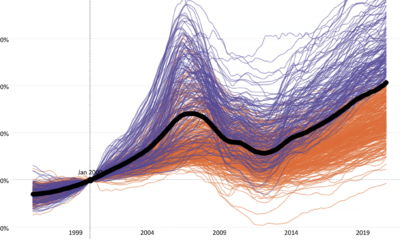
This interactive visualization tracks two decades of home price changes in hundreds of cities in the United States.
Internet adoption is widespread in the U.S. In fact, only 7% of Americans do not use the internet. Who are these non-adopters?
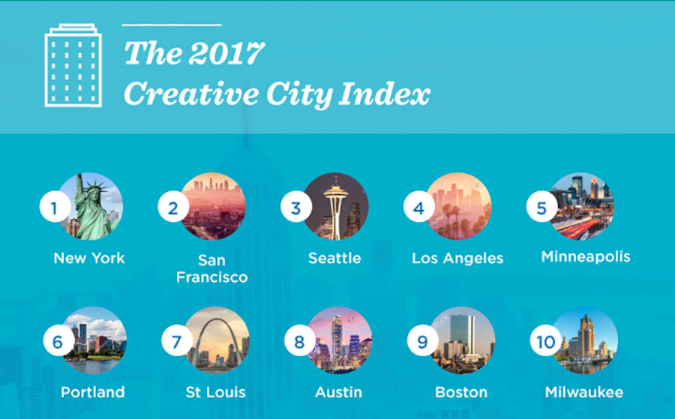
The creative economy is a vital contributor to economic health, but it's a hard thing to measure. Here are some of the most creative cities in...
This graphic shows the percentage of Americans that are monthly music listeners for each service. Which online music service is most popular?
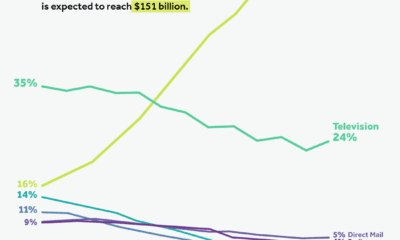
Internet advertising has shown steady growth in the last decade. By 2024, it’s projected to capture 60% of total ad spend in the United States.
Just two countries account for half of the top 20 cities with the most billionaires. And the majority of the other half are found in Asia.
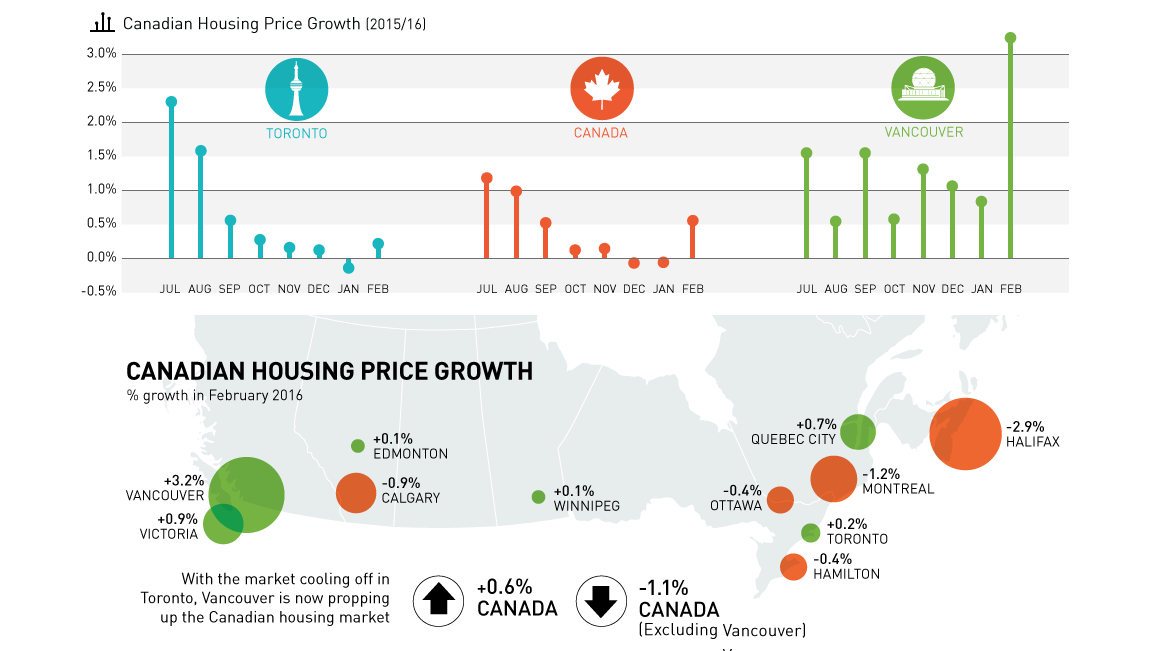
There's only one pillar left holding up the Canadian housing market. Without Vancouver, housing prices would have declined nationally by -1.1% in February.
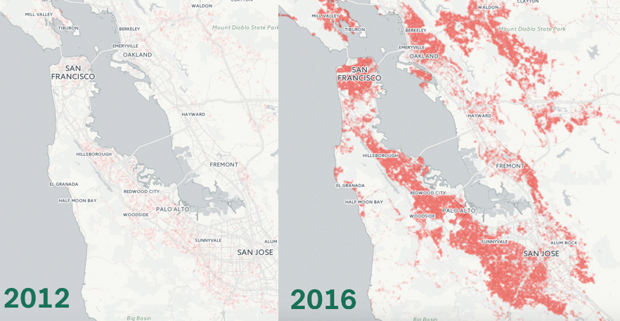
This animation shows the growth in million dollar homes in the Bay Area over the last four years. Today, the majority of homes in SF are...
This graphic compares the cost of living and purchasing power of 578 cities worldwide, using New York City as a benchmark for comparison.
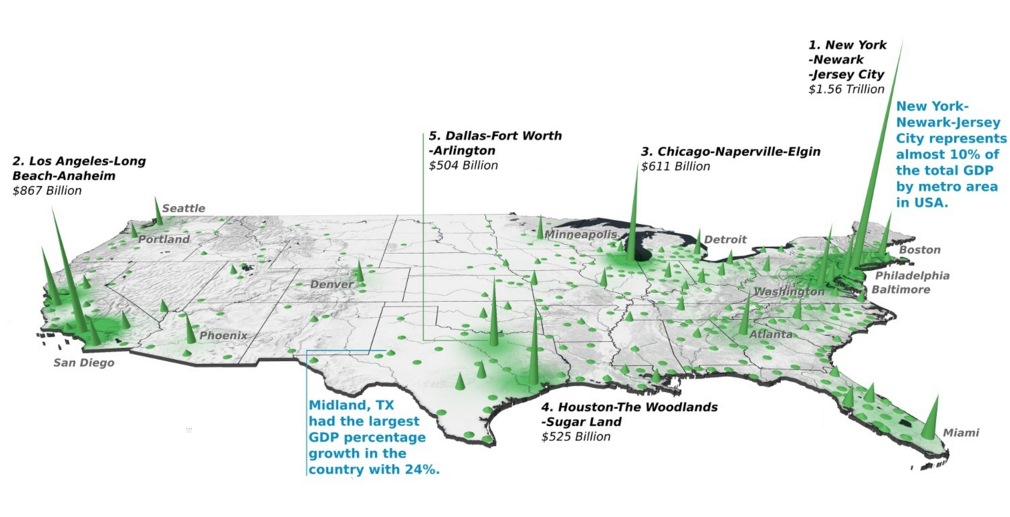
Did you know that the Top 20 metropolitan areas in the U.S. contribute 52% of the total country's GDP? See how it breaks down by city...


 Creator Program