Markets
Housing Madness: 57% of Homes in This U.S. City are Worth $1M+
There is no shortage of Bay Area housing anecdotes floating around. Whether it’s the tale of billboards that advertise new homes in San Francisco starting at “only” $1 million dollars, or a Google employee who must move into a 128-square-foot truck in the company’s parking lot to effectively save money, these unusual stories make it clear that the housing market in the Bay Area is bordering on insanity.
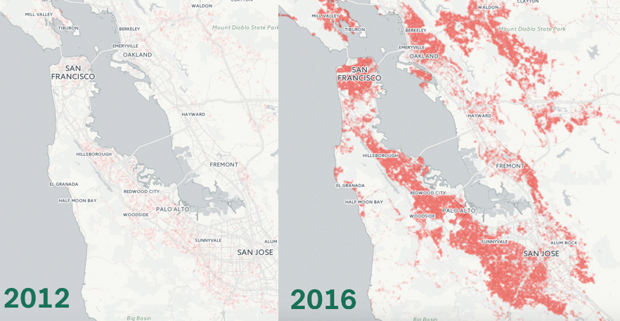
However, if you want more quantitative proof of the housing bubble that is plaguing the Bay Area, this map should do it. Using data from the real estate website Trulia, this animation plots the number of million dollar homes in the Bay Area.
In 2012, just under 20% of homes in San Francisco were worth over $1 million. Today, over 57% of homes have hit the mark, meaning that the majority of homes are now selling for over seven figures.
While San Francisco gets the majority of the attention for its housing prices, the situation is actually much wider in scope. San Jose and Oakland have seen the percentage of such houses increase to 46.3% and 19.7% respectively. Meanwhile, in Southern California, the number of $1 million houses have doubled in both San Diego and Los Angeles over the last four years.
Million Dollar Housing Markets in the U.S.
| City | $1MM homes (2012) | $1MM homes (2016) | Percentage point change |
|---|---|---|---|
| San Francisco, CA | 19.6% | 57.4% | +37.8% |
| San Jose, CA | 17.4% | 46.3% | +28.9% |
| Oakland, CA | 5.2% | 19.7% | +14.5% |
| Orange County, CA | 7.1% | 16.1% | +8.9% |
| Los Angeles, CA | 8.0% | 16.3% | +8.3% |
| Honolulu, HI | 8.1% | 15.4% | +7.3% |
| San Diego, CA | 5.4% | 10.7% | +5.2% |
| New York, NY | 7.0% | 12.0% | +4.9% |
| Ventura County, CA | 4.3% | 9.0% | +4.6% |
| Seattle, WA | 2.5% | 7.0% | +4.5% |
Data courtesy of: Trulia
Looking at individual neighborhoods, the numbers get even more intense. In Westwood Park in San Francisco, for example, only 2.9% of homes were worth over a million dollars in 2012. Today, 96.0% of houses there hit the mark, leaving only a few pockets that have some element of affordability.
Just south of the San Francisco airport is the neighborhood of Nineteenth Avenue in San Mateo. There, not a single house can be found for under $1 million. This wasn’t the case in 2012, when only about 10% of houses were in seven digit territory.
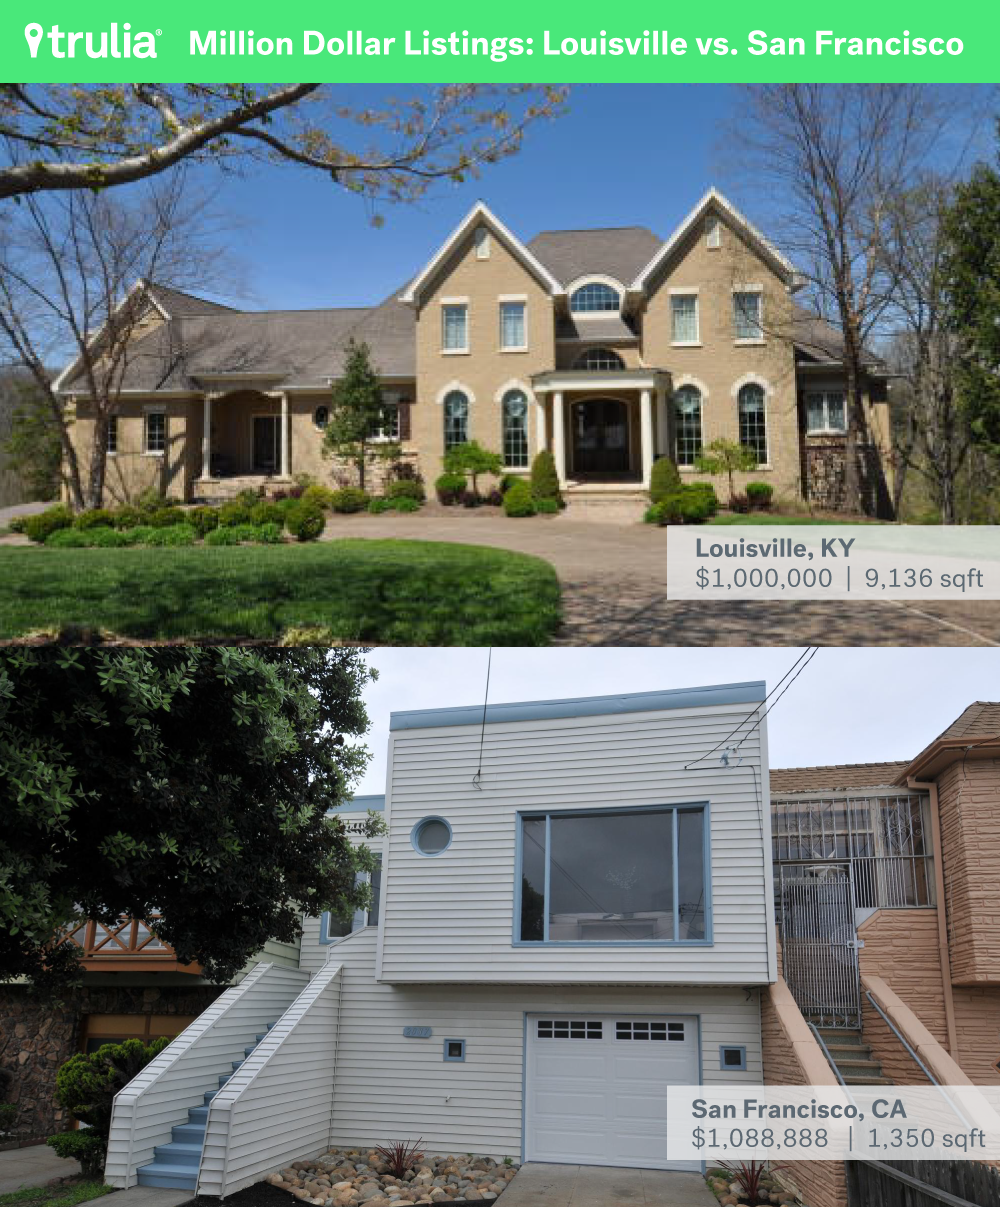
Interested in buying in San Francisco yet?
Here’s a final comparison to show what you could own with a cool million:


Markets
Ranked: The Largest U.S. Corporations by Number of Employees
We visualized the top U.S. companies by employees, revealing the massive scale of retailers like Walmart, Target, and Home Depot.


The Largest U.S. Corporations by Number of Employees
This was originally posted on our Voronoi app. Download the app for free on Apple or Android and discover incredible data-driven charts from a variety of trusted sources.
Revenue and profit are common measures for measuring the size of a business, but what about employee headcount?
To see how big companies have become from a human perspective, we’ve visualized the top U.S. companies by employees. These figures come from companiesmarketcap.com, and were accessed in March 2024. Note that this ranking includes publicly-traded companies only.
Data and Highlights
The data we used to create this list of largest U.S. corporations by number of employees can be found in the table below.
| Company | Sector | Number of Employees |
|---|---|---|
| Walmart | Consumer Staples | 2,100,000 |
| Amazon | Consumer Discretionary | 1,500,000 |
| UPS | Industrials | 500,000 |
| Home Depot | Consumer Discretionary | 470,000 |
| Concentrix | Information Technology | 440,000 |
| Target | Consumer Staples | 440,000 |
| Kroger | Consumer Staples | 430,000 |
| UnitedHealth | Health Care | 400,000 |
| Berkshire Hathaway | Financials | 383,000 |
| Starbucks | Consumer Discretionary | 381,000 |
| Marriott International | Consumer Discretionary | 377,000 |
| Cognizant | Information Technology | 346,600 |
Retail and Logistics Top the List
Companies like Walmart, Target, and Kroger have a massive headcount due to having many locations spread across the country, which require everything from cashiers to IT professionals.
Moving goods around the world is also highly labor intensive, explaining why UPS has half a million employees globally.
Below the Radar?
Two companies that rank among the largest U.S. corporations by employees which may be less familiar to the public include Concentrix and Cognizant. Both of these companies are B2B brands, meaning they primarily work with other companies rather than consumers. This contrasts with brands like Amazon or Home Depot, which are much more visible among average consumers.
A Note on Berkshire Hathaway
Warren Buffett’s company doesn’t directly employ 383,000 people. This headcount actually includes the employees of the firm’s many subsidiaries, such as GEICO (insurance), Dairy Queen (retail), and Duracell (batteries).
If you’re curious to see how Buffett’s empire has grown over the years, check out this animated graphic that visualizes the growth of Berkshire Hathaway’s portfolio from 1994 to 2022.

-

 Business2 weeks ago
America’s Top Companies by Revenue (1994 vs. 2023)
-

 Environment1 week ago
Ranked: Top Countries by Total Forest Loss Since 2001
-

 Markets2 weeks ago
Visualizing America’s Shortage of Affordable Homes
-

 Maps2 weeks ago
Mapped: Average Wages Across Europe
-

 Mining2 weeks ago
Charted: The Value Gap Between the Gold Price and Gold Miners
-

 Demographics2 weeks ago
Visualizing the Size of the Global Senior Population
-

 Misc2 weeks ago
Tesla Is Once Again the World’s Best-Selling EV Company
-

 Technology2 weeks ago
Ranked: The Most Popular Smartphone Brands in the U.S.