Mapped: The 10 U.S. States With the Lowest Real GDP Growth
Ranked: The World’s 50 Largest Private Equity Firms
Top 10 Countries Most in Debt to the IMF
Ranked: The Top 6 Economies by Share of Global GDP (1980-2024)
Mapped: Europe’s GDP Per Capita, by Country
Countries With the Highest Rates of Crypto Ownership
Mapped: The Number of AI Startups By Country
All of the Grants Given by the U.S. CHIPS Act
Visualizing AI Patents by Country
How Tech Logos Have Evolved Over Time
Visualizing America’s Average Retirement Savings, by Age
Visualizing the Tax Burden of Every U.S. State
Charted: What Frustrates Americans About the Tax System
Ranked: The Top 20 Countries in Debt to China
Mapped: Countries Where Recreational Cannabis is Legal
Which Countries Have the Highest Infant Mortality Rates?
Life Expectancy by Region (1950-2050F)
What Causes Preventable Child Deaths?
The Cost of an EpiPen in Major Markets
Who’s Building the Most Solar Energy?
Mapped: The Age of Energy Projects in Interconnection Queues, by State
Ranked: The Top 10 EV Battery Manufacturers in 2023
The World’s Biggest Nuclear Energy Producers
The World’s Biggest Oil Producers in 2023
Mapped: The Top Exports in Asian Countries
Mapped: U.S. States By Number of Cities Over 250,000 Residents
Mapped: U.S. Immigrants by Region
The Biggest Salt Producing Countries in 2023
Visualizing Copper Production by Country in 2023
Where the World’s Aluminum is Smelted, by Country
Visualizing Global Gold Production in 2023
How People Get Around in America, Europe, and Asia
The Carbon Footprint of Major Travel Methods
Ranking the Top 15 Countries by Carbon Tax Revenue
Ranked: The Countries With the Most Air Pollution in 2023
Top Countries By Forest Growth Since 2001
In this list, we count down the 14 best Visual Capitalist infographics of 2014.
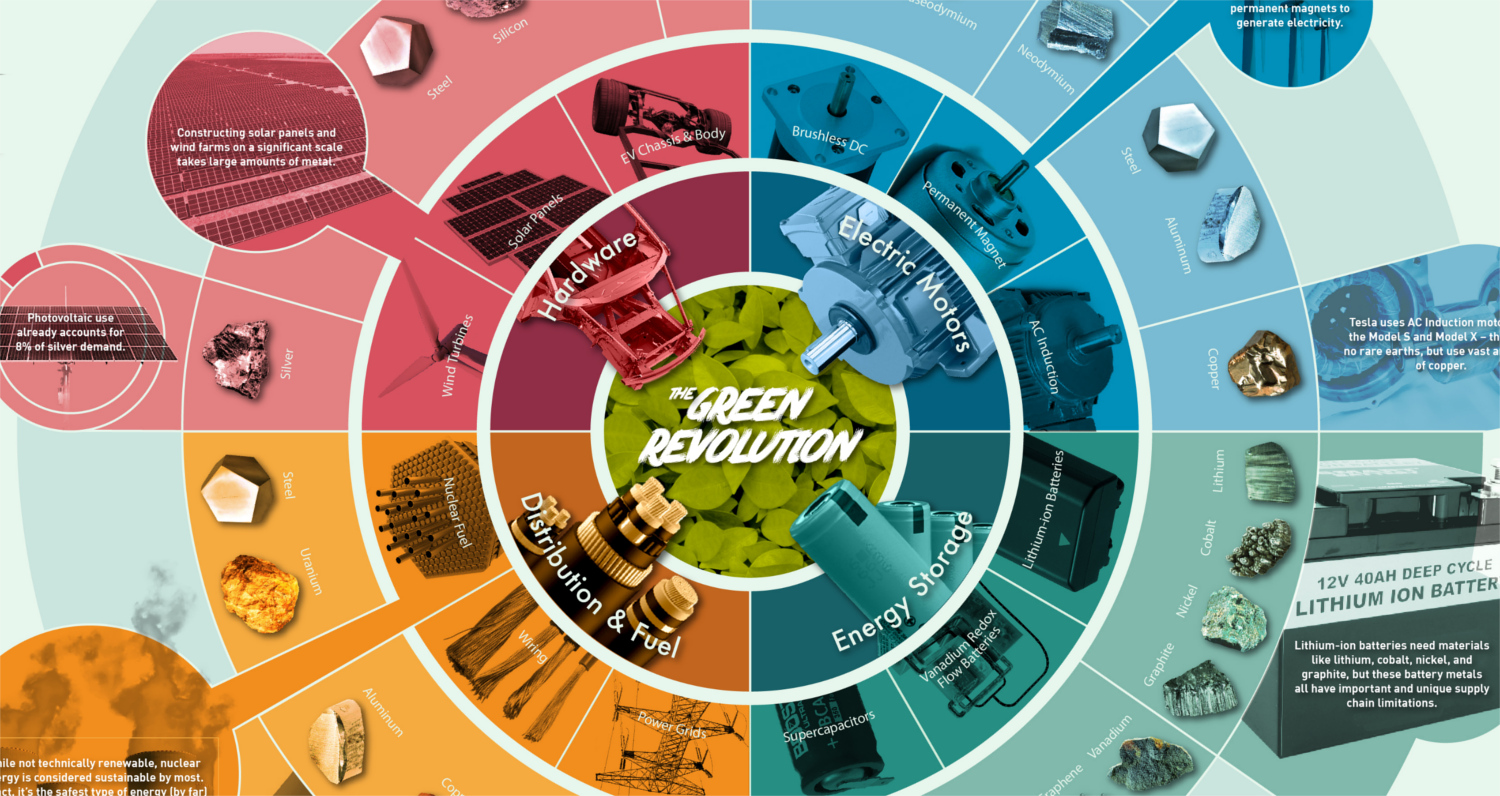
To get off fossil fuels, we'll need other finite resources such as rare metals and minerals. Here are the resources that will power the green revolution.
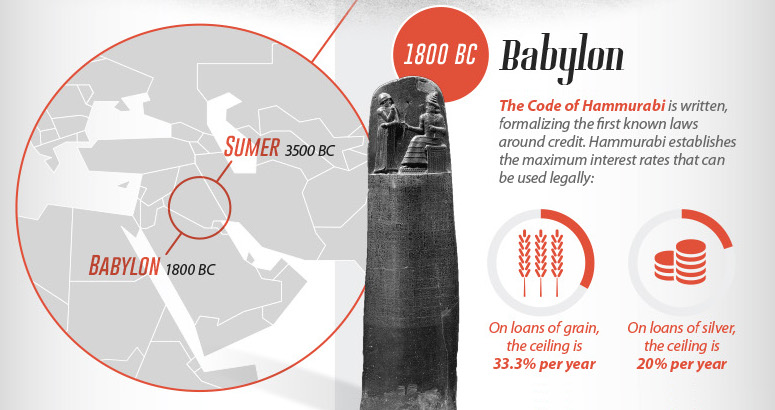
From the writings of antiquity to the innovations that fueled the modern debt boom, we look at the history of consumer credit in this massive infographic.
We roundup the best infographics, charts, and data visualizations that were posted over the year. Don't miss Visual Capitalist's Top Infographics of 2016!
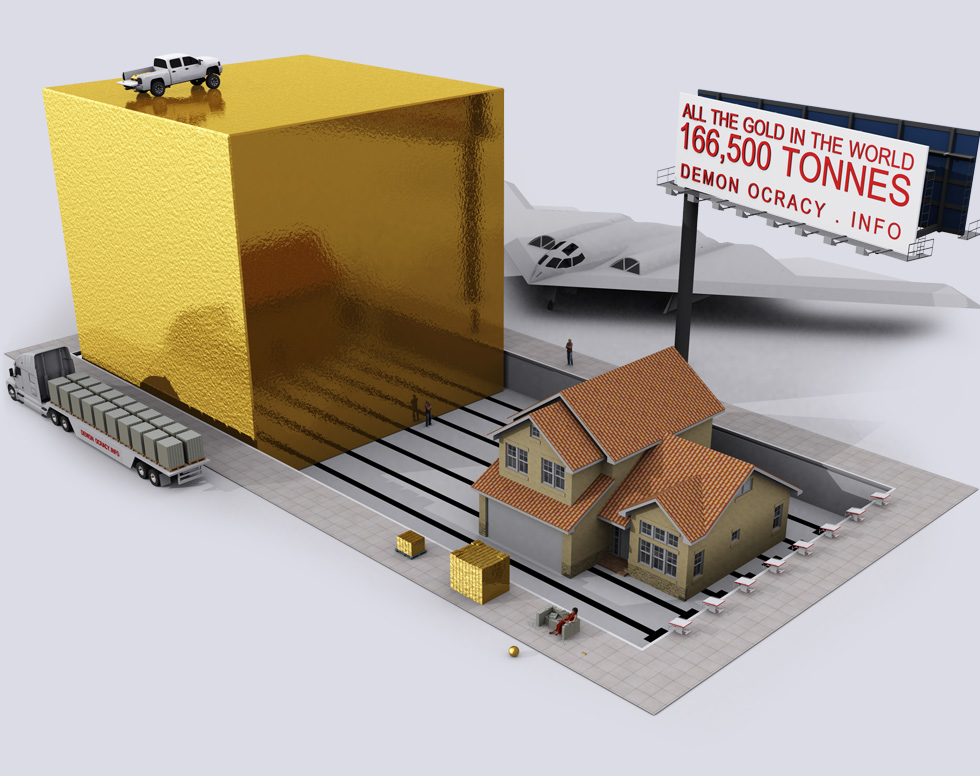
How rare is gold? This set of 3D visualizations show the world's gold in bullion bars.
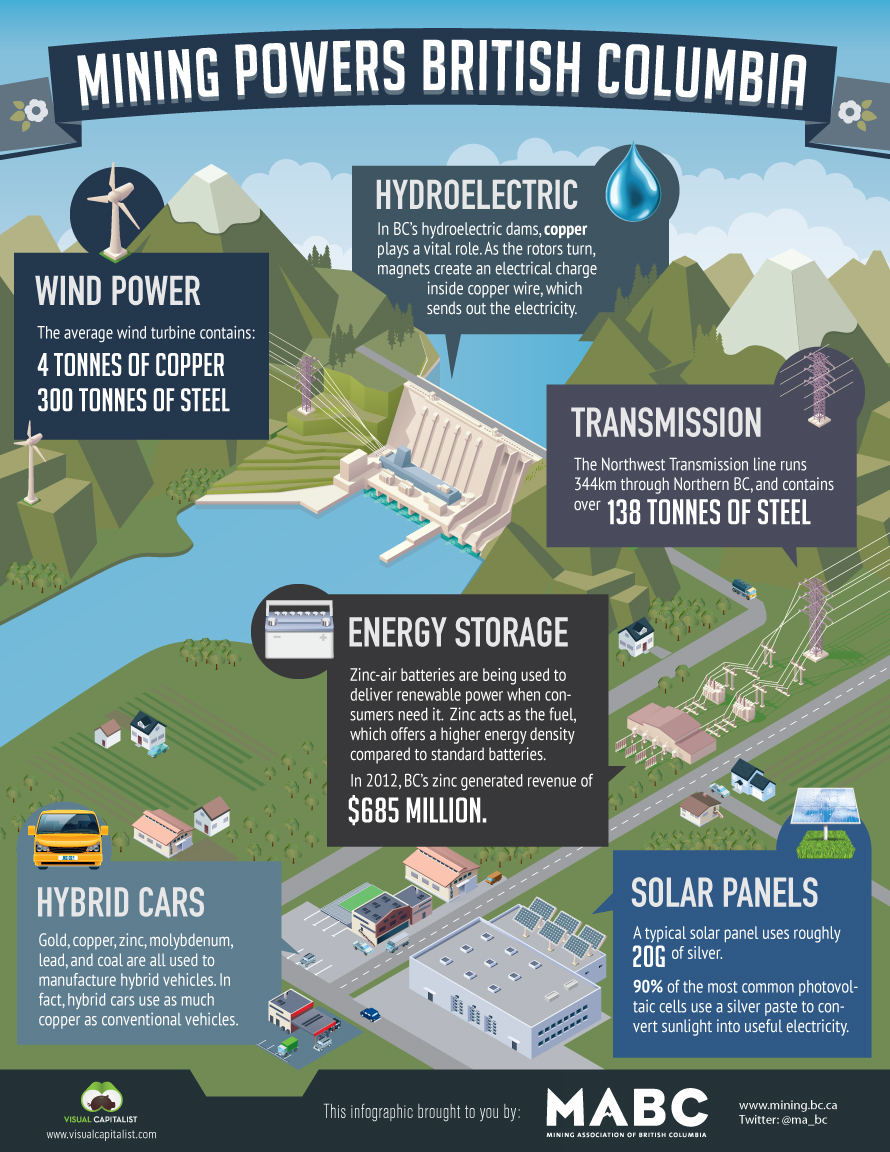
Part of the Mining Builds British Columbia series presented by the Mining Association of BC. About Mining Builds British Columbia Everything used by British Columbians in...
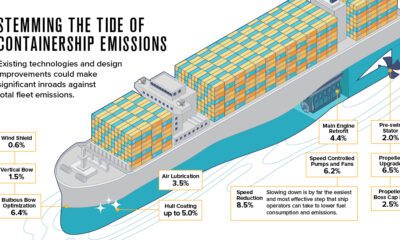
The shipping industry is responsible for 2.89% of all carbon emissions. Here are three ways it could evolve to address climate change.
This pie chart, circa 1914, is a fascinating breakdown of China's export economy just prior to World War I.
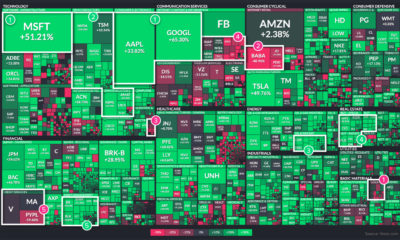
2021 was yet another tumultuous year. Which stock market sectors thrived during the twists and turns of the last 12 months, and which faltered?
Nuclear power is among the world's cleanest sources of energy, but how did uranium and nuclear power come to be?