Mapped: The 10 U.S. States With the Lowest Real GDP Growth
Ranked: The World’s 50 Largest Private Equity Firms
Top 10 Countries Most in Debt to the IMF
Ranked: The Top 6 Economies by Share of Global GDP (1980-2024)
Mapped: Europe’s GDP Per Capita, by Country
Ranked: The Top Startup Cities Around the World
Visualizing the 5 Most Common Cybersecurity Mistakes
Countries With the Highest Rates of Crypto Ownership
Mapped: The Number of AI Startups By Country
All of the Grants Given by the U.S. CHIPS Act
Visualizing America’s Average Retirement Savings, by Age
Visualizing the Tax Burden of Every U.S. State
Charted: What Frustrates Americans About the Tax System
Ranked: The Top 20 Countries in Debt to China
Mapped: Countries Where Recreational Cannabis is Legal
Which Countries Have the Highest Infant Mortality Rates?
Life Expectancy by Region (1950-2050F)
What Causes Preventable Child Deaths?
The Cost of an EpiPen in Major Markets
Who’s Building the Most Solar Energy?
Mapped: The Age of Energy Projects in Interconnection Queues, by State
Ranked: The Top 10 EV Battery Manufacturers in 2023
The World’s Biggest Nuclear Energy Producers
The World’s Biggest Oil Producers in 2023
Mapped: Indian States with Cities Over 1 Million People
Mapped: The Top Export in Each EU Country
Mapped: The Top Exports in Asian Countries
Mapped: U.S. States By Number of Cities Over 250,000 Residents
The Biggest Salt Producing Countries in 2023
Visualizing Copper Production by Country in 2023
Where the World’s Aluminum is Smelted, by Country
Visualizing Global Gold Production in 2023
How People Get Around in America, Europe, and Asia
The Carbon Footprint of Major Travel Methods
Ranking the Top 15 Countries by Carbon Tax Revenue
Ranked: The Countries With the Most Air Pollution in 2023
Top Countries By Forest Growth Since 2001
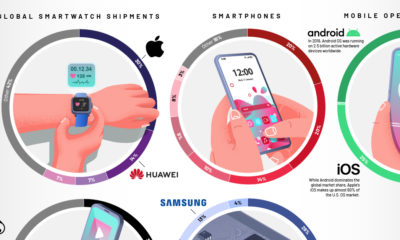
This graphic provides a snapshot of the leading brands currently dominating the personal tech market across the globe.
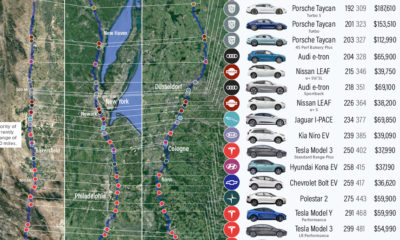
We visualize how far popular EV models will take you on real-world routes between major cities, and which are the most cost effective.
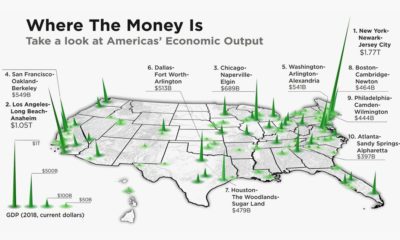
The total U.S. GDP stands at a whopping $21 trillion, but which metro areas contribute to the most in terms of economic output?
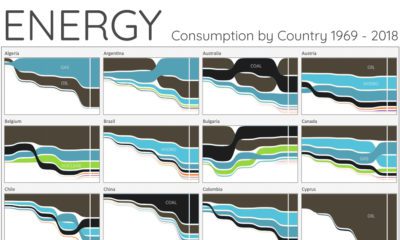
For the last 50 years, fossil fuels have dominated energy consumption. This chart looks at how the energy mix is changing in over 60+ countries.
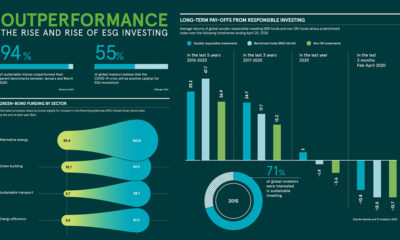
With ESG investing outperforming benchmarks, could green bonds be next in line? We unpack the megatrend taking hold of the financial world.
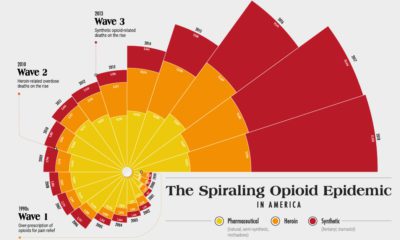
Since the 1990s, the opioid crisis has claimed thousands of lives. This visualization shows how the epidemic has come in three distinct waves.
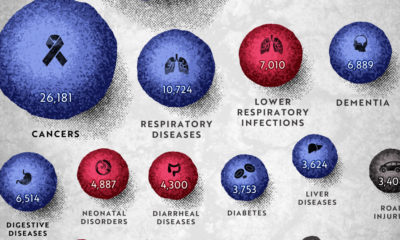
COVID-19 deaths can be hard to interpret without context. This graphic shows how many people die each day globally, by cause.
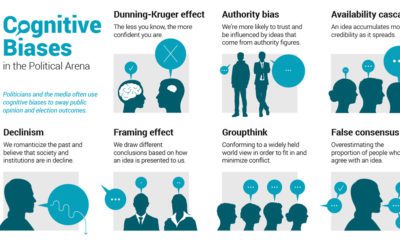
Humans are hardwired to make mental mistakes called cognitive biases. Here are common biases that can shape political opinion, and even elections.
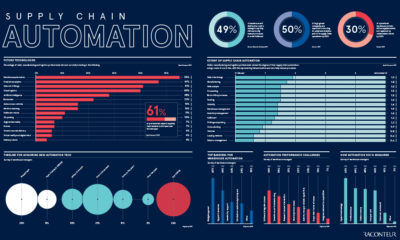
As COVID-19 disrupts global supply chains, we take a look at how industries are investing in automation—and what this is tells us about the future.
As millions of people continue to show up for work during the COVID-19 pandemic, many face a higher risk of potential exposure to the virus.