Misc
The Spiraling Opioid Epidemic in America


The Spiraling Opioid Epidemic in America
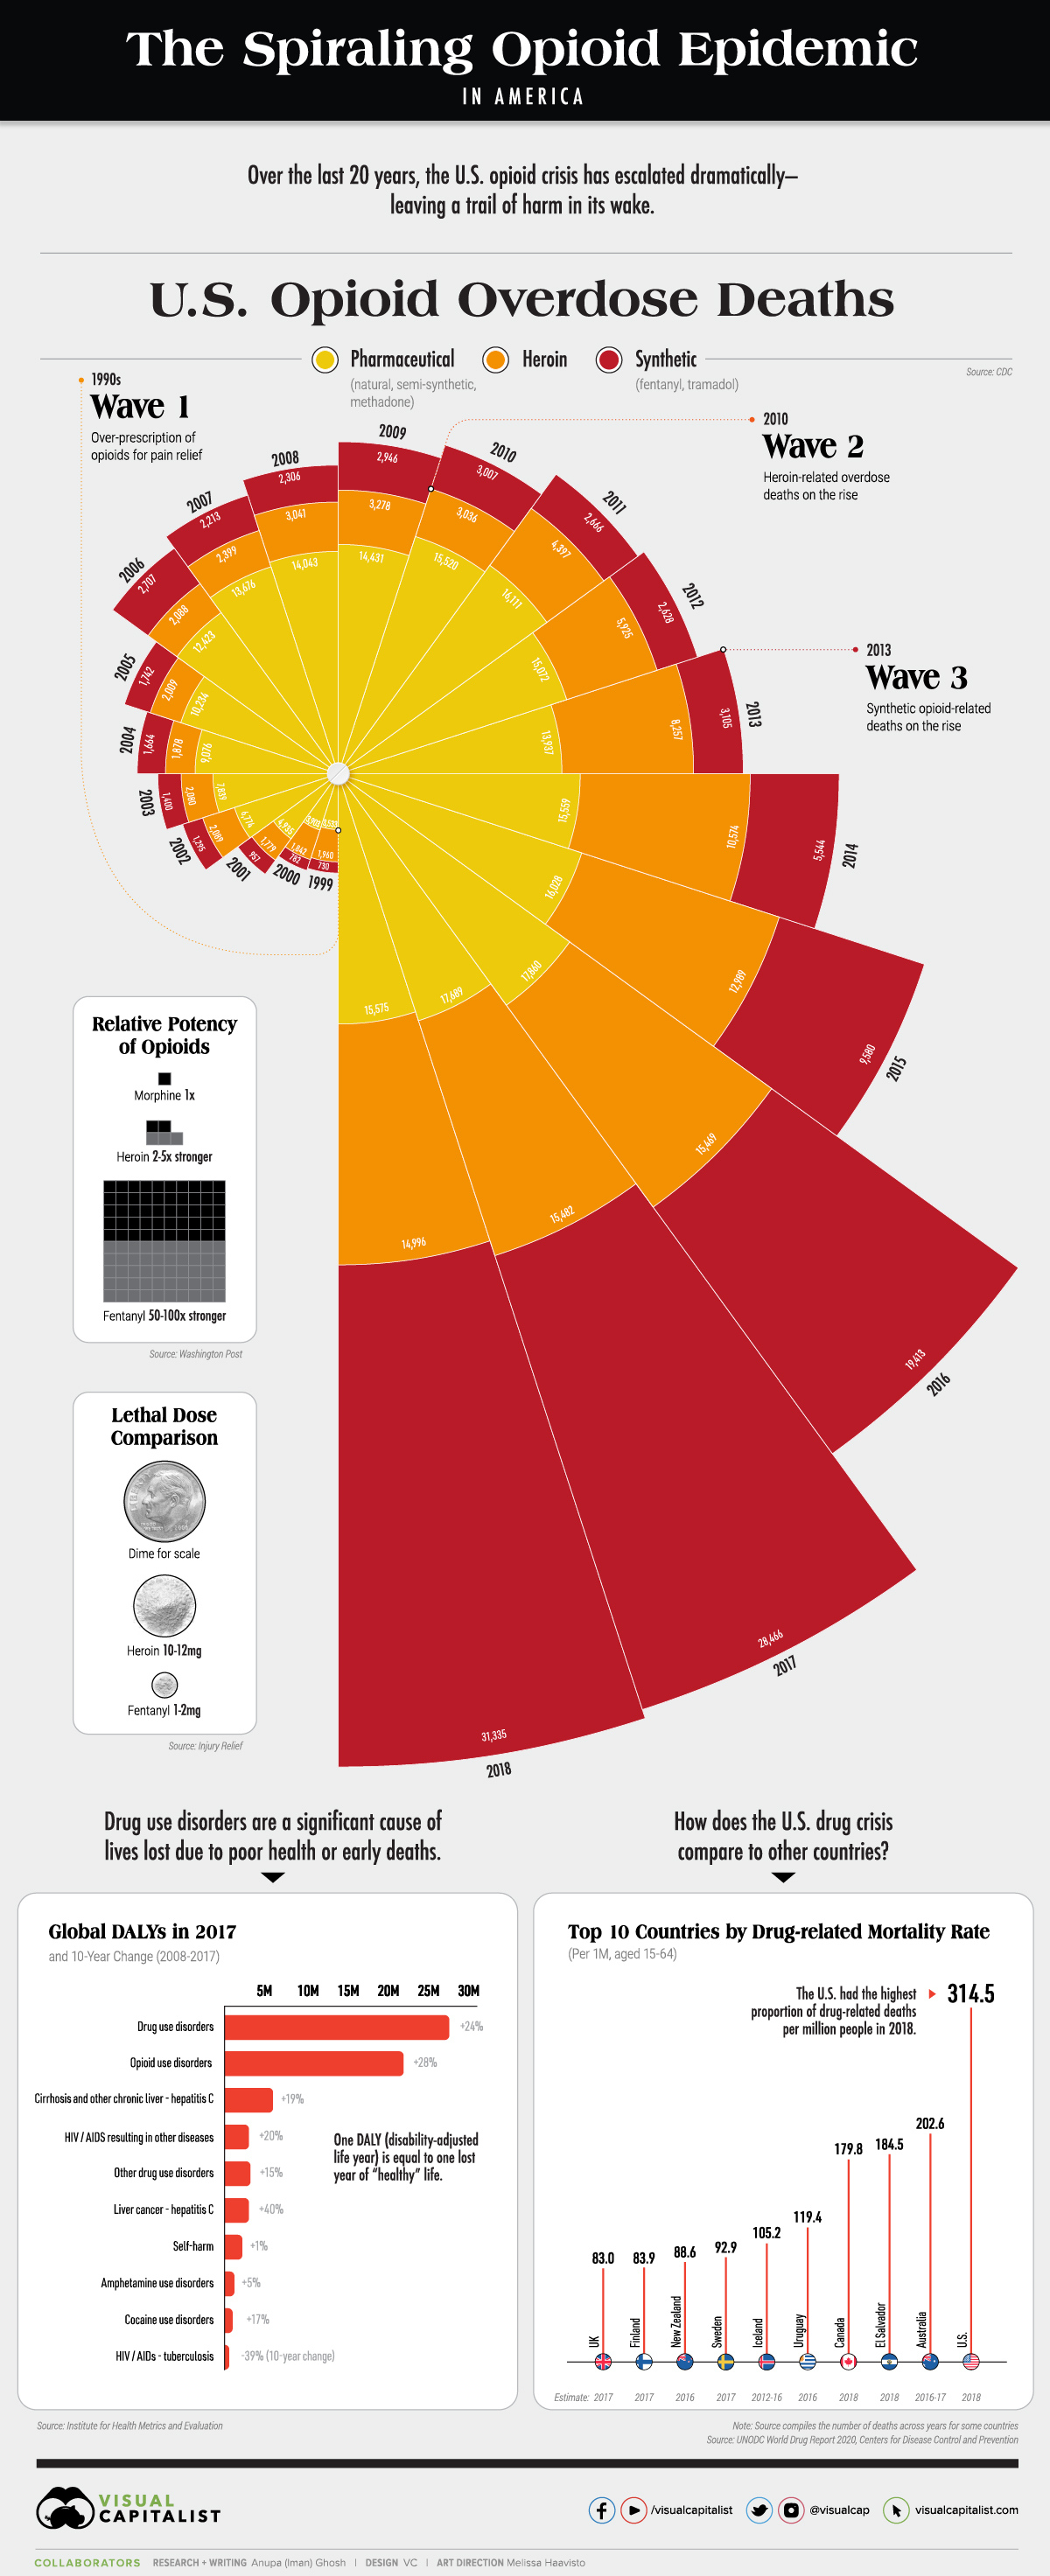
Over the last 20 years, the ongoing U.S. opioid crisis has claimed tens of thousands of lives. In fact, opioid overdose deaths accounted for nearly 70% of all drug overdose deaths in 2018.
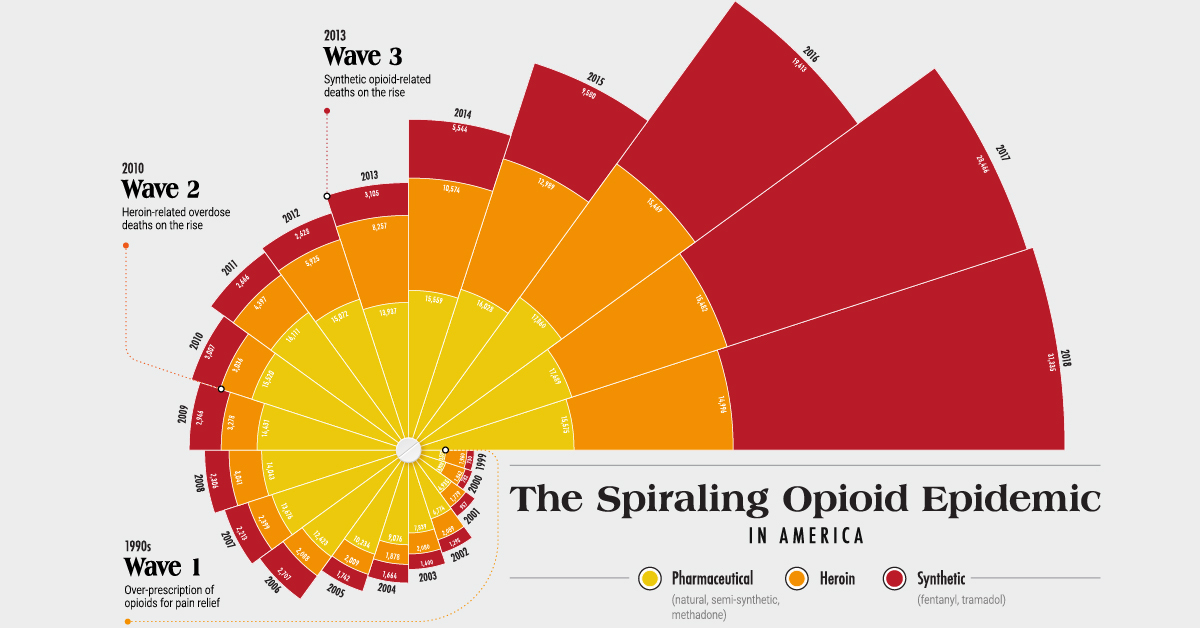
Although the damage of the opioid epidemic is well documented, what people might not know is that it has escalated in three distinct waves.
We pull the latest statistics from the UN World Drug Report 2020 to uncover the scope of the opioid crisis in the U.S., and how national drug-related death rates compare to other countries.
Three Waves of the Opioid Crisis
According to the CDC, the opioid epidemic can be traced back to the 1990s, when opioids started being over-prescribed for pain relief purposes.
- 1990s – Wave 1
Over-prescription of opioids for pain relief, including natural opioids, semi-synthetic opioids, and methadone. Addiction risks were widely downplayed. - 2010 – Wave 2
Heroin-related overdose deaths on the rise. - 2013 – Wave 3
Synthetic opioid-related deaths on the rise, particularly fentanyl and tramadol.
Here’s how that breaks down in terms of opioid-related overdose deaths over the years. Note that by the year 2018, 67% of overdose deaths involved synthetic opioids such as fentanyl.
| Year | Any opioids | Heroin | Pharmaceutical opioids | Synthetic opioids |
|---|---|---|---|---|
| 1999 | 8,050 | 1,960 | 3,533 | 730 |
| 2000 | 8,407 | 1,842 | 3,903 | 782 |
| 2001 | 9,496 | 1,779 | 4,935 | 957 |
| 2002 | 11,920 | 2,089 | 6,774 | 1,295 |
| 2003 | 12,940 | 2,080 | 7,839 | 1,400 |
| 2004 | 13,756 | 1,878 | 9,076 | 1,664 |
| 2005 | 14,918 | 2,009 | 10,234 | 1,742 |
| 2006 | 17,545 | 2,088 | 12,423 | 2,707 |
| 2007 | 18,516 | 2,399 | 13,676 | 2,213 |
| 2008 | 19,582 | 3,041 | 14,043 | 2,306 |
| 2009 | 20,422 | 3,278 | 14,431 | 2,946 |
| 2010 | 21,089 | 3,036 | 15,520 | 3,007 |
| 2011 | 22,784 | 4,397 | 16,111 | 2,666 |
| 2012 | 23,166 | 5,925 | 15,072 | 2,628 |
| 2013 | 25,052 | 8,257 | 13,937 | 3,105 |
| 2014 | 28,647 | 10,574 | 15,559 | 5,544 |
| 2015 | 33,091 | 12,989 | 16,028 | 9,580 |
| 2016 | 42,249 | 15,469 | 17,860 | 19,413 |
| 2017 | 47,600 | 15,482 | 17,689 | 28,466 |
| 2018 | 46,802 | 14,996 | 15,575 | 31,335 |
Overdose deaths from synthetic opioids such as fentanyl and tramadol shot up by over 4,000% between 1999-2018. This can be attributed to two things: their relative potency, and the minute quantities of each that qualify as a lethal dose.
As per the medical and legal standard, opioids are often compared to morphine. To that end, heroin is 2-5x stronger—while fentanyl is 50-100x more potent. Put another way, roughly a dime-size or 10-12mg of heroin is considered a lethal dose, compared to only 1-2mg of fentanyl.
What’s worse, fentanyl is typically mixed with other types of drugs such as heroin or cocaine to increase their effects, which is how it ends up unintentionally ingested. Between 2008-2017, drug-use disorders as a whole claimed the most healthy lives due to poor health or early deaths—measured in disability-adjusted life years (DALYs)—followed in close second by opioid use disorders.
The Death Toll of U.S. Drug Overdoses
It’s undeniable that the opioid epidemic in America has caused significant harm to communities. But how does the U.S. drug crisis compare to the same issue in other countries?
The UN Drug Report further puts these numbers into perspective by comparing drug-related deaths per million population. Note that the source also compiled the total deaths across years for selected countries.
| Country (Latest Year) | Latest Years of Estimate | Total Deaths | Rate per 1M (Aged 15-64) |
|---|---|---|---|
| 🇺🇸 U.S. | 2018 | 67,367 | 314.5 |
| 🇦🇺 Australia | 2016-2017 | 3,240 | 202.6 |
| 🇸🇻 El Salvador | 2018 | 765 | 184.5 |
| 🇨🇦 Canada | 2018 | 4,460 | 179.8 |
| 🇺🇾 Uruguay | 2016 | 264 | 119.4 |
| 🇮🇸 Iceland | 2012-2016 | 23 | 105.2 |
| 🇸🇪 Sweden | 2017 | 575 | 92.9 |
| 🇳🇿 New Zealand | 2016 | 269 | 88.6 |
| 🇫🇮 Finland | 2017 | 289 | 83.9 |
| 🇬🇧 UK | 2017 | 3,547 | 83 |
With 314.5 deaths per million, the U.S. by far had the highest proportion of drug-related deaths per million people in 2018. It also had the highest overall number at 67.4K deaths.
Elephant in the Room?
Another drug rearing its head on the streets is carfentanil. Formerly developed as ‘elephant tranquilizer’, this synthetic opioid is similar in appearance to other illicit drugs such as heroin, making it indistinguishable when mixed in. However, there’s one big problem—carfentanil is 100x more potent than fentanyl itself.
In response to the continued crisis, an additional $35.7 billion was requested for counter-drug funding efforts in the FY2021 Budget. This amount is expected to go towards prevention and treatment efforts ($18.6 billion) and law enforcement efforts ($17.1 billion) both domestically and internationally.
But will these efforts properly combat the crisis, or are we already in the midst of a fourth wave of the opioid epidemic?


Misc
How Hard Is It to Get Into an Ivy League School?
We detail the admission rates and average annual cost for Ivy League schools, as well as the median SAT scores required to be accepted.


How Hard Is It to Get Into an Ivy League School?
This was originally posted on our Voronoi app. Download the app for free on iOS or Android and discover incredible data-driven charts from a variety of trusted sources.
Ivy League institutions are renowned worldwide for their academic excellence and long-standing traditions. But how hard is it to get into one of the top universities in the U.S.?
In this graphic, we detail the admission rates and average annual cost for Ivy League schools, as well as the median SAT scores required to be accepted. The data comes from the National Center for Education Statistics and was compiled by 24/7 Wall St.
Note that “average annual cost” represents the net price a student pays after subtracting the average value of grants and/or scholarships received.
Harvard is the Most Selective
The SAT is a standardized test commonly used for college admissions in the United States. It’s taken by high school juniors and seniors to assess their readiness for college-level academic work.
When comparing SAT scores, Harvard and Dartmouth are among the most challenging universities to gain admission to. The median SAT scores for their students are 760 for reading and writing and 790 for math. Still, Harvard has half the admission rate (3.2%) compared to Dartmouth (6.4%).
| School | Admission rate (%) | SAT Score: Reading & Writing | SAT Score: Math | Avg Annual Cost* |
|---|---|---|---|---|
| Harvard University | 3.2 | 760 | 790 | $13,259 |
| Columbia University | 3.9 | 750 | 780 | $12,836 |
| Yale University | 4.6 | 760 | 780 | $16,341 |
| Brown University | 5.1 | 760 | 780 | $26,308 |
| Princeton University | 5.7 | 760 | 780 | $11,080 |
| Dartmouth College | 6.4 | 760 | 790 | $33,023 |
| University of Pennsylvania | 6.5 | 750 | 790 | $14,851 |
| Cornell University | 7.5 | 750 | 780 | $29,011 |
*Costs after receiving federal financial aid.
Additionally, Dartmouth has the highest average annual cost at $33,000. Princeton has the lowest at $11,100.
While student debt has surged in the United States in recent years, hitting $1.73 trillion in 2023, the worth of obtaining a degree from any of the schools listed surpasses mere academics. This is evidenced by the substantial incomes earned by former students.
Harvard grads, for example, have the highest average starting salary in the country, at $91,700.

-

 Mining2 weeks ago
Charted: The Value Gap Between the Gold Price and Gold Miners
-

 Real Estate1 week ago
Ranked: The Most Valuable Housing Markets in America
-

 Business1 week ago
Charted: Big Four Market Share by S&P 500 Audits
-

 AI1 week ago
The Stock Performance of U.S. Chipmakers So Far in 2024
-

 Misc1 week ago
Almost Every EV Stock is Down After Q1 2024
-

 Money2 weeks ago
Where Does One U.S. Tax Dollar Go?
-

 Green2 weeks ago
Ranked: Top Countries by Total Forest Loss Since 2001
-

 Real Estate2 weeks ago
Visualizing America’s Shortage of Affordable Homes