Misc
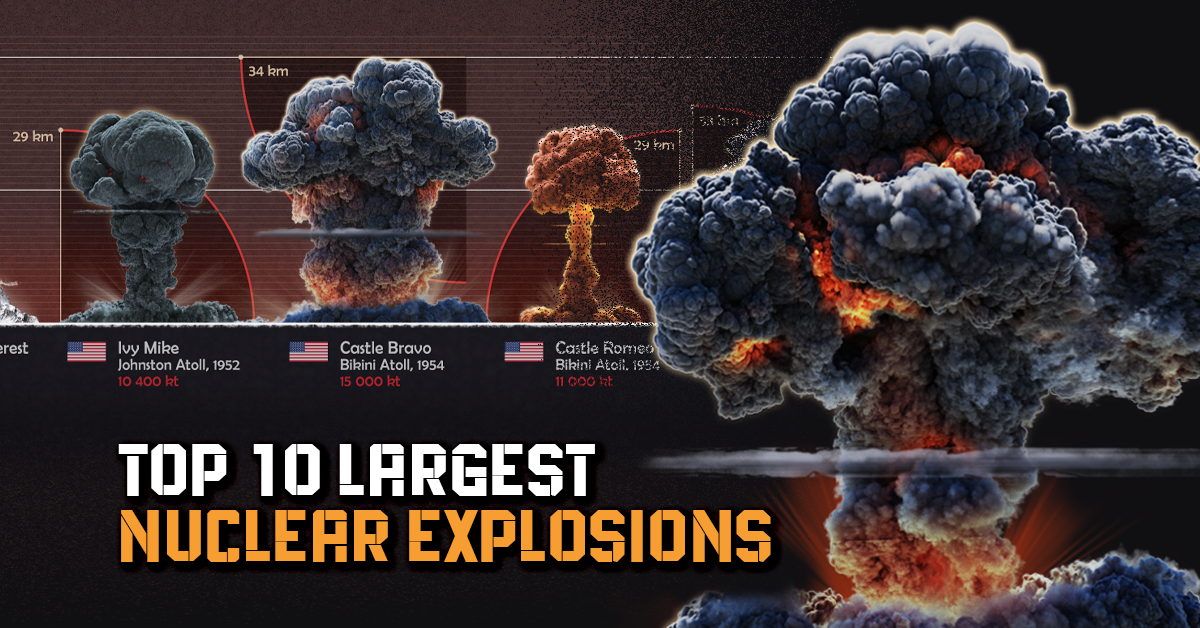
The Top 10 Largest Nuclear Explosions, Visualized


The Top 10 Largest Nuclear Explosions, Visualized
Just how powerful are nuclear explosions?
The U.S.’ Trinity test in 1945, the first-ever nuclear detonation, released around 19 kilotons of explosive energy. The explosion instantly vaporized the tower it stood on and turned the surrounding sand into green glass, before sending a powerful heatwave across the desert.
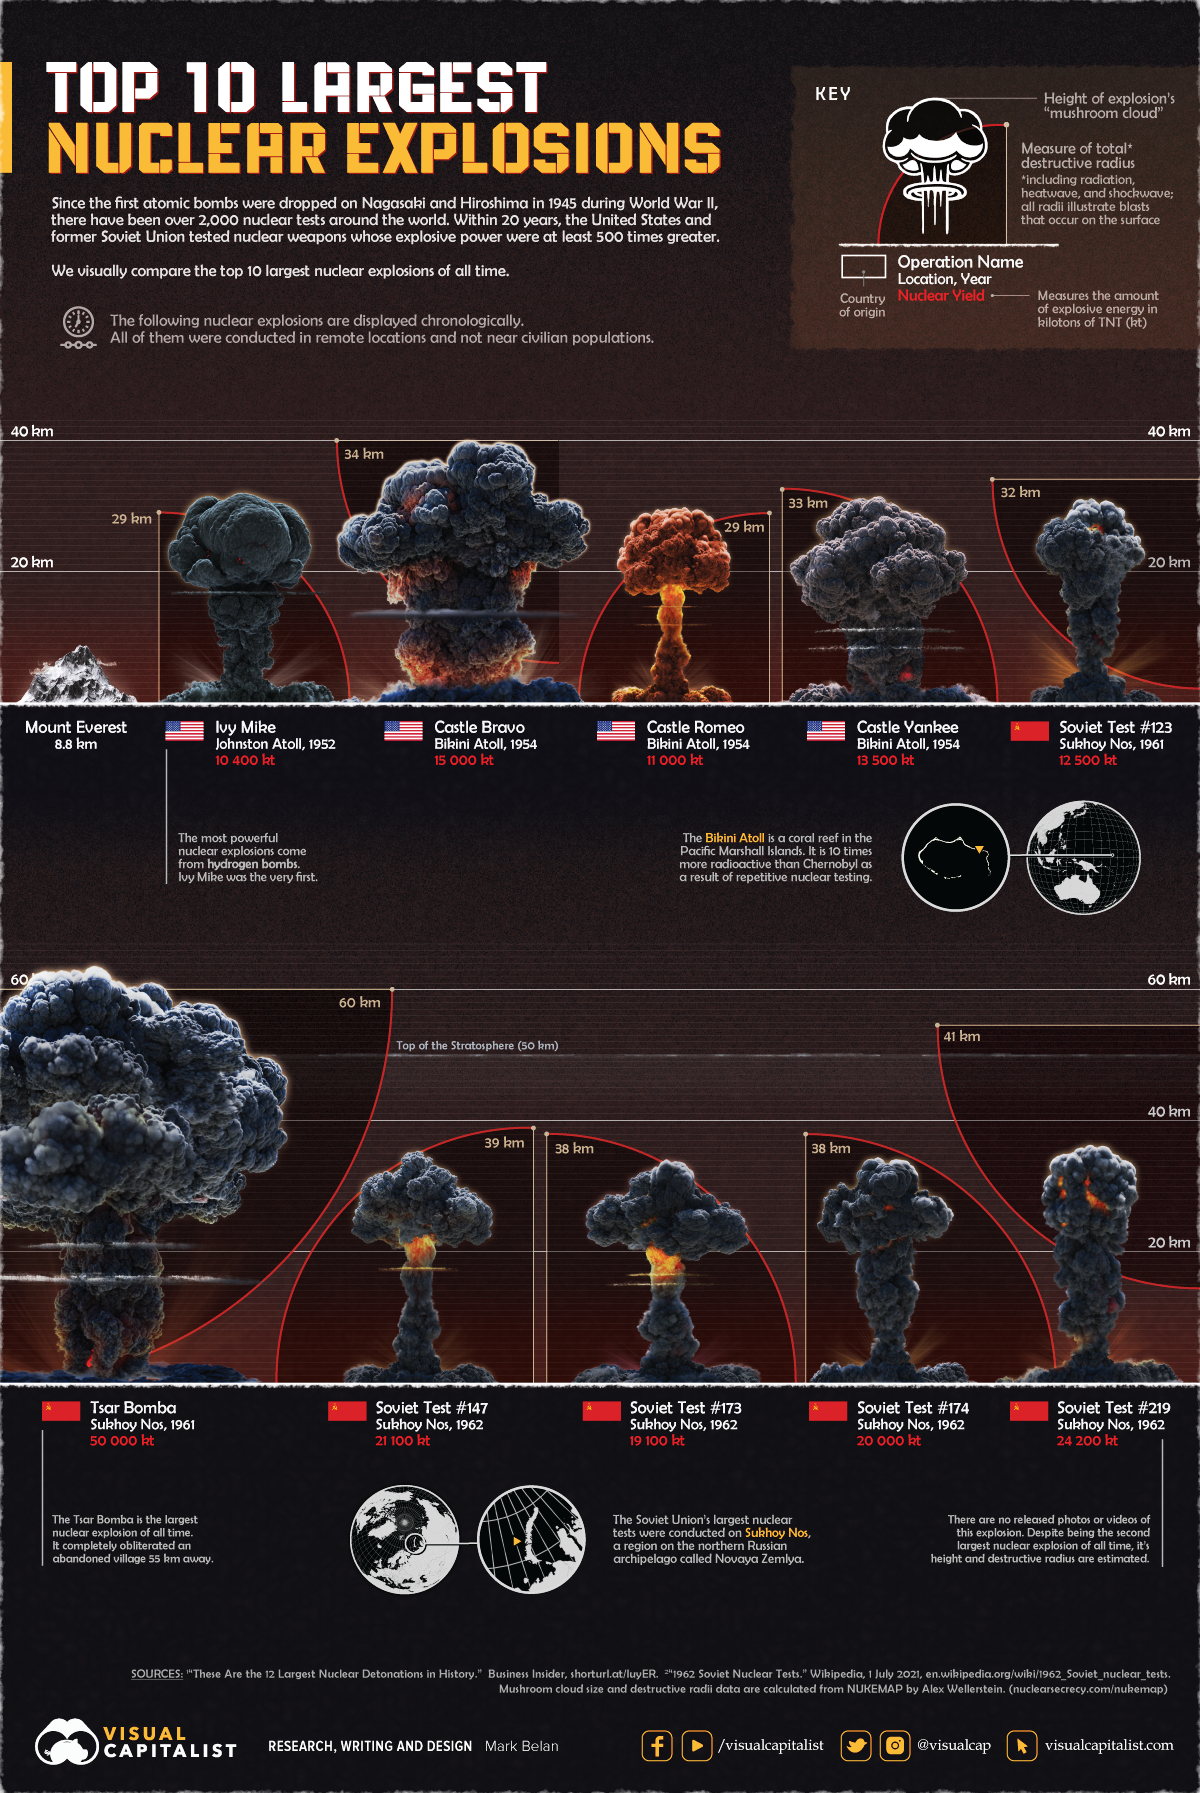
As the Cold War escalated in the years after WWII, the U.S. and the Soviet Union tested bombs that were at least 500 times greater in explosive power. This infographic visually compares the 10 largest nuclear explosions in history.
The Anatomy of a Nuclear Explosion
After exploding, nuclear bombs create giant fireballs that generate a blinding flash and a searing heatwave. The fireball engulfs the surrounding air, getting larger as it rises like a hot air balloon.
As the fireball and heated air rise, they are flattened by cooler, denser air high up in the atmosphere, creating the mushroom “cap” structure. At the base of the cloud, the fireball causes physical destruction by sending a shockwave moving outwards at thousands of miles an hour.
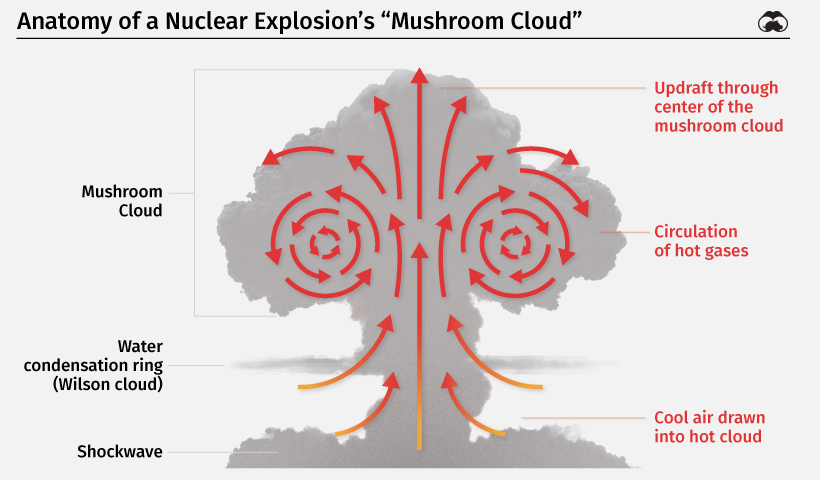
A strong updraft of air and dirt particles through the center of the cloud forms the “stem” of the mushroom cloud. In most atomic explosions, changing atmospheric pressure and water condensation create rings that surround the cloud, also known as Wilson clouds.
Over time, the mushroom cloud dissipates. However, it leaves behind radioactive fallout in the form of nuclear particles, debris, dust, and ash, causing lasting damage to the local environment. Because the particles are lightweight, global wind patterns often distribute them far beyond the place of detonation.
With this context in mind, here’s a look at the 10 largest nuclear explosions.
#10: Ivy Mike (1952)
In 1952, the U.S. detonated the Mike device—the first-ever hydrogen bomb—as part of Operation Ivy. Hydrogen bombs rely on nuclear fusion to amplify their explosions, producing much more explosive energy than atomic bombs that use nuclear fission.
Weighing 140,000 pounds (63,500kg), the Ivy Mike test generated a yield of 10,400 kilotons, equivalent to the explosive power of 10.4 million tons of TNT. The explosion was 700 times more powerful than Little Boy, the bomb dropped on Hiroshima in 1945.
#9: Castle Romeo (1954)
Castle Romeo was part of the Operation Castle series of U.S. nuclear tests taking place on the Marshall Islands. Shockingly, the U.S. was running out of islands to conduct tests, making Romeo the first-ever test conducted on a barge in the ocean.
At 11,000 kilotons, the test produced more than double its predicted explosive energy of 4,000 kilotons. Its fireball, as seen below, is one of the most iconic images ever captured of a nuclear explosion.

#8: Soviet Test #123 (1961)
Test #123 was one of the 57 tests conducted by the Soviet Union in 1961. Most of these tests were conducted on the Novaya Zemlya archipelago in Northwestern Russia. The bomb yielded 12,500 kilotons of explosive energy, enough to vaporize everything within a 2.1 mile (3.5km) radius.
#7: Castle Yankee (1954)
Castle Yankee was the fifth test in Operation Castle. The explosion marked the second-most powerful nuclear test by the U.S.
It yielded 13,500 kilotons, much higher than the predicted yield of up to 10,000 kilotons. Within four days of the blast, its fallout reached Mexico City, roughly 7,100 miles (11,400km) away.
#6: Castle Bravo (1954)
Castle Bravo, the first of the Castle Operation series, accidentally became the most powerful nuclear bomb tested by the U.S.
Due to a design error, the explosive energy from the bomb reached 15,000 kilotons, two and a half times what was expected. The mushroom cloud climbed up to roughly 25 miles (40km).
As a result of the test, an area of 7,000 square miles was contaminated, and inhabitants of nearby atolls were exposed to high levels of radioactive fallout. Traces of the blast were found in Australia, India, Japan, and Europe.
#5, #4, #3: Soviet Tests #173, #174, #147 (1962)
In 1962, the Soviet Union conducted 78 nuclear tests, three of which produced the fifth, fourth, and third-most powerful explosions in history. Tests #173, #174, and #147 each yielded around 20,000 kilotons. Due to the absolute secrecy of these tests, no photos or videos have been released.
#2: Soviet Test #219 (1962)
Test #219 was an atmospheric nuclear test carried out using an intercontinental ballistic missile (ICBM), with the bomb exploding at a height of 2.3 miles (3.8km) above sea level. It was the second-most powerful nuclear explosion, with a yield of 24,200 kilotons and a destructive radius of ~25 miles (41km).
#1: Tsar Bomba (1961)
Tsar Bomba, also called Big Ivan, needed a specially designed plane because it was too heavy to carry on conventional aircraft. The bomb was attached to a giant parachute to give the plane time to fly away.
The explosion, yielding 50,000 kilotons, obliterated an abandoned village 34 miles (55km) away and generated a 5.0-5.25 magnitude earthquake in the surrounding region. Initially, it was designed as a 100,000 kiloton bomb, but its yield was cut to half its potential by the Soviet Union. Tsar Bomba’s mushroom cloud breached through the stratosphere to reach a height of over 37 miles (60km), roughly six times the flying height of commercial aircraft.
The two bombs dropped on Hiroshima and Nagasaki had devastating consequences, and their explosive yields were only a fraction of the 10 largest explosions. The power of modern nuclear weapons makes their scale of destruction truly unfathomable, and as history suggests, the outcomes can be unpredictable.


Misc
The Top 25 Nationalities of U.S. Immigrants
Mexico is the largest source of immigrants to the U.S., with almost 11 million immigrants.


The Top 25 Nationalities of U.S. Immigrants
This was originally posted on our Voronoi app. Download the app for free on iOS or Android and discover incredible data-driven charts from a variety of trusted sources.
The United States is home to more than 46 million immigrants, constituting approximately 14% of its total population.
This graphic displays the top 25 countries of origin for U.S. immigrants, based on 2022 estimates. The data is sourced from the Migration Policy Institute (MPI), which analyzed information from the U.S. Census Bureau’s 2022 American Community Survey.
In this context, “immigrants” refer to individuals residing in the United States who were not U.S. citizens at birth.
Mexico Emerges as a Leading Source of Immigration
Mexico stands out as the largest contributor to U.S. immigration due to its geographical proximity and historical ties.
Various economic factors, including wage disparities and employment opportunities, motivate many Mexicans to seek better prospects north of the border.
| Country | Region | # of Immigrants |
|---|---|---|
| 🇲🇽 Mexico | Latin America & Caribbean | 10,678,502 |
| 🇮🇳 India | Asia | 2,839,618 |
| 🇨🇳 China | Asia | 2,217,894 |
| 🇵🇭 Philippines | Asia | 1,982,333 |
| 🇸🇻 El Salvador | Latin America & Caribbean | 1,407,622 |
| 🇻🇳 Vietnam | Asia | 1,331,192 |
| 🇨🇺 Cuba | Latin America & Caribbean | 1,312,510 |
| 🇩🇴 Dominican Republic | Latin America & Caribbean | 1,279,900 |
| 🇬🇹 Guatemala | Latin America & Caribbean | 1,148,543 |
| 🇰🇷 Korea | Asia | 1,045,100 |
| 🇨🇴 Colombia | Latin America & Caribbean | 928,053 |
| 🇭🇳 Honduras | Latin America & Caribbean | 843,774 |
| 🇨🇦 Canada | Northern America | 821,322 |
| 🇯🇲 Jamaica | Latin America & Caribbean | 804,775 |
| 🇭🇹 Haiti | Latin America & Caribbean | 730,780 |
| 🇬🇧 United Kingdom | Europe | 676,652 |
| 🇻🇪 Venezuela | Latin America & Caribbean | 667,664 |
| 🇧🇷 Brazil | Latin America & Caribbean | 618,525 |
| 🇩🇪 Germany | Europe | 537,484 |
| 🇪🇨 Ecuador | Latin America & Caribbean | 518,287 |
| 🇵🇪 Peru | Latin America & Caribbean | 471,988 |
| 🇳🇬 Nigeria | Africa | 448,405 |
| 🇺🇦 Ukraine | Europe | 427,163 |
| 🇮🇷 Iran | Middle East | 407,283 |
| 🇵🇰 Pakistan | Asia | 399,086 |
| Rest of World | 11,637,634 | |
| Total | 46,182,089 |
Mexicans are followed in this ranking by Indians, Chinese, and Filipinos, though most immigrants on this list come from countries in the Latin American and Caribbean region.
On the other hand, only three European countries are among the top sources of U.S. immigrants: the UK, Germany, and Ukraine.
Immigration continues to be a significant factor contributing to the overall growth of the U.S. population. Overall population growth has decelerated over the past decade primarily due to declining birth rates.
Between 2021 and 2022, the increase in the immigrant population accounted for 65% of the total population growth in the U.S., representing 912,000 individuals out of nearly 1.4 million.
If you enjoyed this post, be sure to check out Visualized: Why Do People Immigrate to the U.S.? This visualization shows the different reasons cited by new arrivals to America in 2021.

-

 Personal Finance1 week ago
Visualizing the Tax Burden of Every U.S. State
-

 Misc6 days ago
Visualized: Aircraft Carriers by Country
-

 Brands6 days ago
How Popular Snack Brand Logos Have Changed
-

 Mining1 week ago
Visualizing Copper Production by Country in 2023
-

 Politics1 week ago
Charted: How Americans Feel About Federal Government Agencies
-

 Healthcare1 week ago
Which Countries Have the Highest Infant Mortality Rates?
-

 Demographics1 week ago
Mapped: U.S. Immigrants by Region
-

 Maps1 week ago
Mapped: Southeast Asia’s GDP Per Capita, by Country