Misc
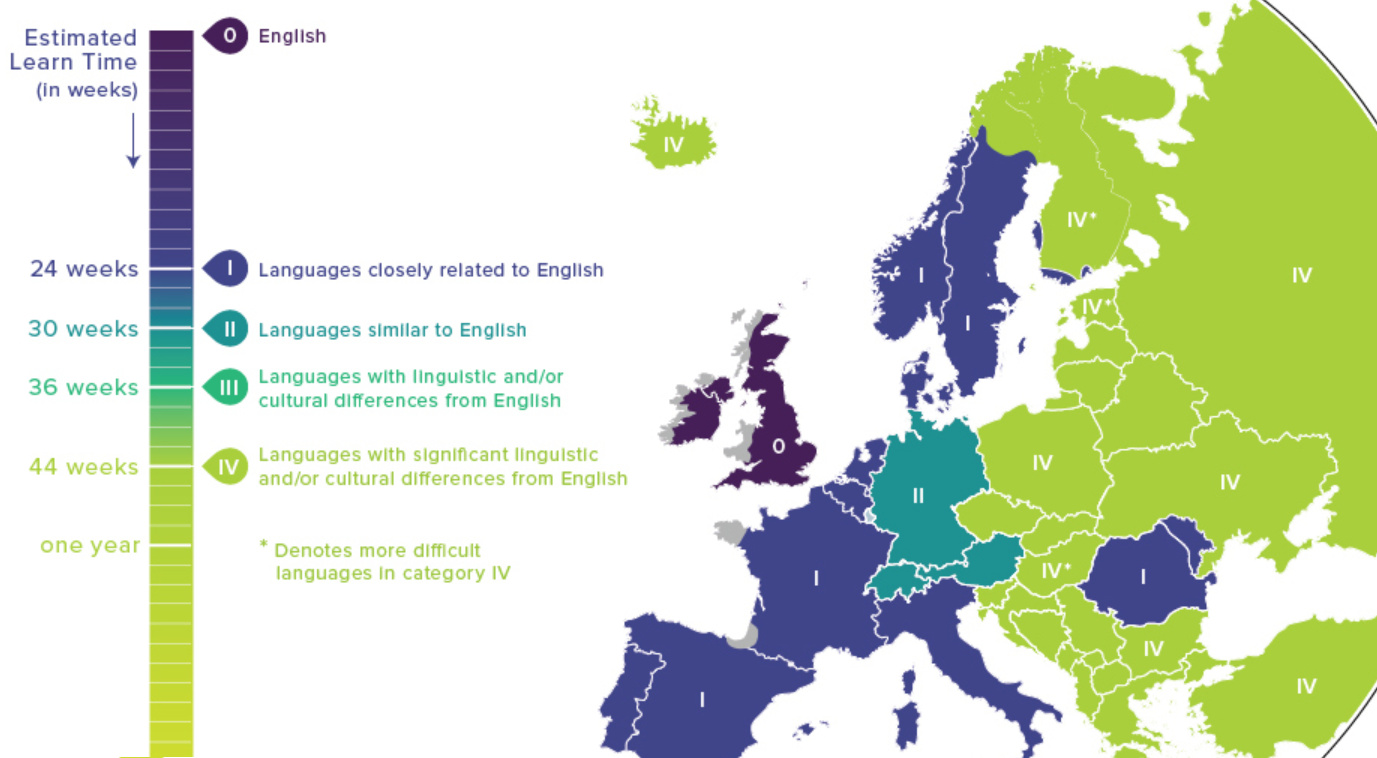
Map: Language Difficulty Ranking For English Speakers
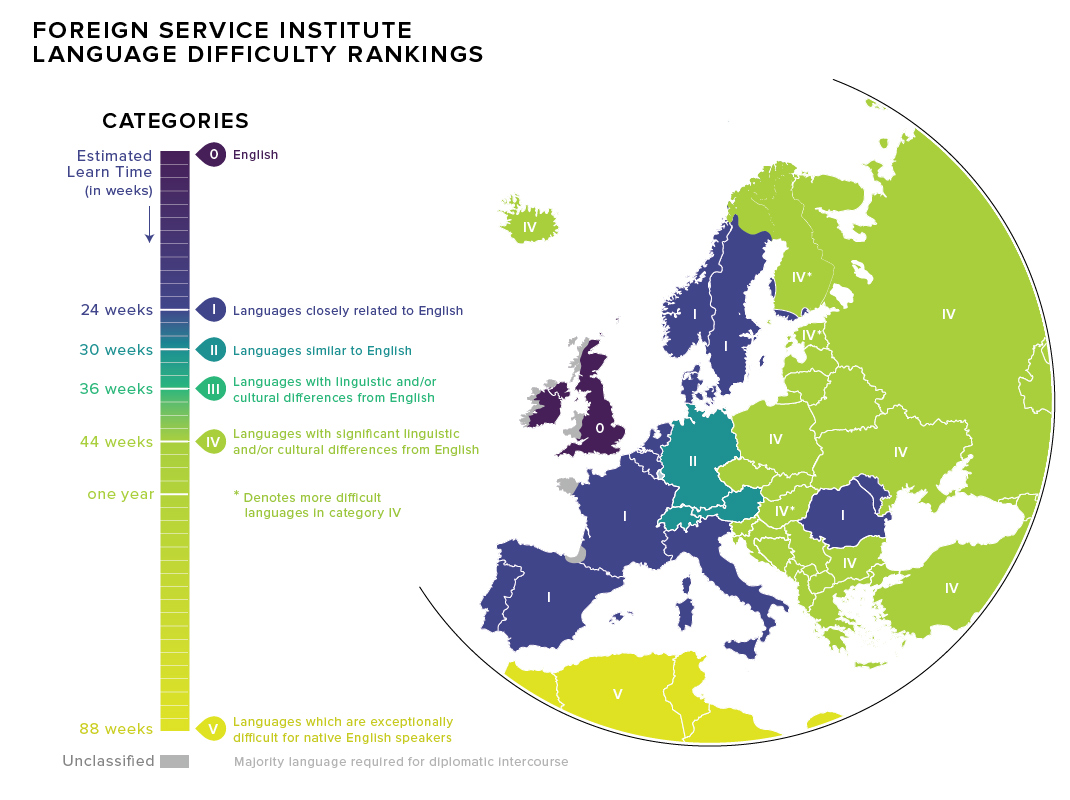
Language Difficulty Ranking For English Speakers
Learning a new language as an adult is big undertaking – so if you want the best value for your time, choose wisely.
For most people, there are no time constraints on becoming fluent in another language, but for the Foreign Service Institute – the U.S. government’s main provider of foreign affairs training – quantifying the “learn time” of various languages is vital. American diplomats, for example, need to become proficient in the official language of their posting country, and it helps immensely to know how long that might take.
The FSI organizes languages into five broad categories based on how different each language and culture is to the United States:
Category I: The Quick Ones
Category I languages are the easiest for English speakers, who can reach reading and speaking proficiency within about half a year of intense study. There is a mix Romance and Germanic languages in this classification, including Dutch, Swedish, French, Spanish, and Italian.
It might be surprising also to learn that Afrikaans is in this “easiest” category as well. It uses 26 letters in its alphabet like English (although it also contains additional phonetic sounds), and has a lot in common with modern Dutch.
Category II: Es ist schwer zu sagen
Though German is very closely related to English, there are grammar quirks that bump it up in difficulty. FSI estimates it would take 30 weeks of intense study to become proficient in German.
Category III: Intermediate
Category III languages are mainly spoken in Southeast Asia, and they include Indonesian and Malay. Swahili also counts as a Category III language. (Note: there are no Category III languages spoken in Europe.)
Category IV: For people who like a challenge
Category IV includes the most challenging European languages for English speakers to pick up. Here you’ll find Slavic and Baltic languages such as Polish, Croatian, and Latvian, as well as Greek, Turkish, and Icelandic.
This category also includes Finnish, Estonian and Hungarian. These Uralic languages have the distinction of being particularly challenging for English speakers to master as they have little in common with any other European languages. FSI estimates it would take a year of intense study to become proficient in these languages.
Category V: For people who really like a challenge
Languages in category V are the most challenging for English speakers because they generally have completely unfamiliar scripts and cultural assumptions. These languages are most common in Asia and the Middle East.
While Mandarin, Arabic, and Korean are sufficiently difficult to comprehend, Japanese has a reputation for being the toughest in this group thanks, in part, to multiple writing styles.
Mastering Japanese could take years, but FSI estimates that it’ll be at least 88 weeks before you’re chatting your way through Tokyo.
べんきょうがんばってください。
This map was inspired by one created by Redditor, Fummy.


Misc
The Top 25 Nationalities of U.S. Immigrants
Mexico is the largest source of immigrants to the U.S., with almost 11 million immigrants.


The Top 25 Nationalities of U.S. Immigrants
This was originally posted on our Voronoi app. Download the app for free on iOS or Android and discover incredible data-driven charts from a variety of trusted sources.
The United States is home to more than 46 million immigrants, constituting approximately 14% of its total population.
This graphic displays the top 25 countries of origin for U.S. immigrants, based on 2022 estimates. The data is sourced from the Migration Policy Institute (MPI), which analyzed information from the U.S. Census Bureau’s 2022 American Community Survey.
In this context, “immigrants” refer to individuals residing in the United States who were not U.S. citizens at birth.
Mexico Emerges as a Leading Source of Immigration
Mexico stands out as the largest contributor to U.S. immigration due to its geographical proximity and historical ties.
Various economic factors, including wage disparities and employment opportunities, motivate many Mexicans to seek better prospects north of the border.
| Country | Region | # of Immigrants |
|---|---|---|
| 🇲🇽 Mexico | Latin America & Caribbean | 10,678,502 |
| 🇮🇳 India | Asia | 2,839,618 |
| 🇨🇳 China | Asia | 2,217,894 |
| 🇵🇭 Philippines | Asia | 1,982,333 |
| 🇸🇻 El Salvador | Latin America & Caribbean | 1,407,622 |
| 🇻🇳 Vietnam | Asia | 1,331,192 |
| 🇨🇺 Cuba | Latin America & Caribbean | 1,312,510 |
| 🇩🇴 Dominican Republic | Latin America & Caribbean | 1,279,900 |
| 🇬🇹 Guatemala | Latin America & Caribbean | 1,148,543 |
| 🇰🇷 Korea | Asia | 1,045,100 |
| 🇨🇴 Colombia | Latin America & Caribbean | 928,053 |
| 🇭🇳 Honduras | Latin America & Caribbean | 843,774 |
| 🇨🇦 Canada | Northern America | 821,322 |
| 🇯🇲 Jamaica | Latin America & Caribbean | 804,775 |
| 🇭🇹 Haiti | Latin America & Caribbean | 730,780 |
| 🇬🇧 United Kingdom | Europe | 676,652 |
| 🇻🇪 Venezuela | Latin America & Caribbean | 667,664 |
| 🇧🇷 Brazil | Latin America & Caribbean | 618,525 |
| 🇩🇪 Germany | Europe | 537,484 |
| 🇪🇨 Ecuador | Latin America & Caribbean | 518,287 |
| 🇵🇪 Peru | Latin America & Caribbean | 471,988 |
| 🇳🇬 Nigeria | Africa | 448,405 |
| 🇺🇦 Ukraine | Europe | 427,163 |
| 🇮🇷 Iran | Middle East | 407,283 |
| 🇵🇰 Pakistan | Asia | 399,086 |
| Rest of World | 11,637,634 | |
| Total | 46,182,089 |
Mexicans are followed in this ranking by Indians, Chinese, and Filipinos, though most immigrants on this list come from countries in the Latin American and Caribbean region.
On the other hand, only three European countries are among the top sources of U.S. immigrants: the UK, Germany, and Ukraine.
Immigration continues to be a significant factor contributing to the overall growth of the U.S. population. Overall population growth has decelerated over the past decade primarily due to declining birth rates.
Between 2021 and 2022, the increase in the immigrant population accounted for 65% of the total population growth in the U.S., representing 912,000 individuals out of nearly 1.4 million.
If you enjoyed this post, be sure to check out Visualized: Why Do People Immigrate to the U.S.? This visualization shows the different reasons cited by new arrivals to America in 2021.

-

 United States6 days ago
Mapped: Countries Where Recreational Cannabis is Legal
-

 Healthcare2 weeks ago
Life Expectancy by Region (1950-2050F)
-

 Markets2 weeks ago
The Growth of a $1,000 Equity Investment, by Stock Market
-

 Markets2 weeks ago
Mapped: Europe’s GDP Per Capita, by Country
-

 Money2 weeks ago
Charted: What Frustrates Americans About the Tax System
-

 Technology2 weeks ago
Countries With the Highest Rates of Crypto Ownership
-

 Mining2 weeks ago
Where the World’s Aluminum is Smelted, by Country
-

 Personal Finance1 week ago
Visualizing the Tax Burden of Every U.S. State