Maps
Mapped: The U.S. State that Each Country Trades With the Most
Article/Editing:
Click to view this graphic in a higher-resolution.
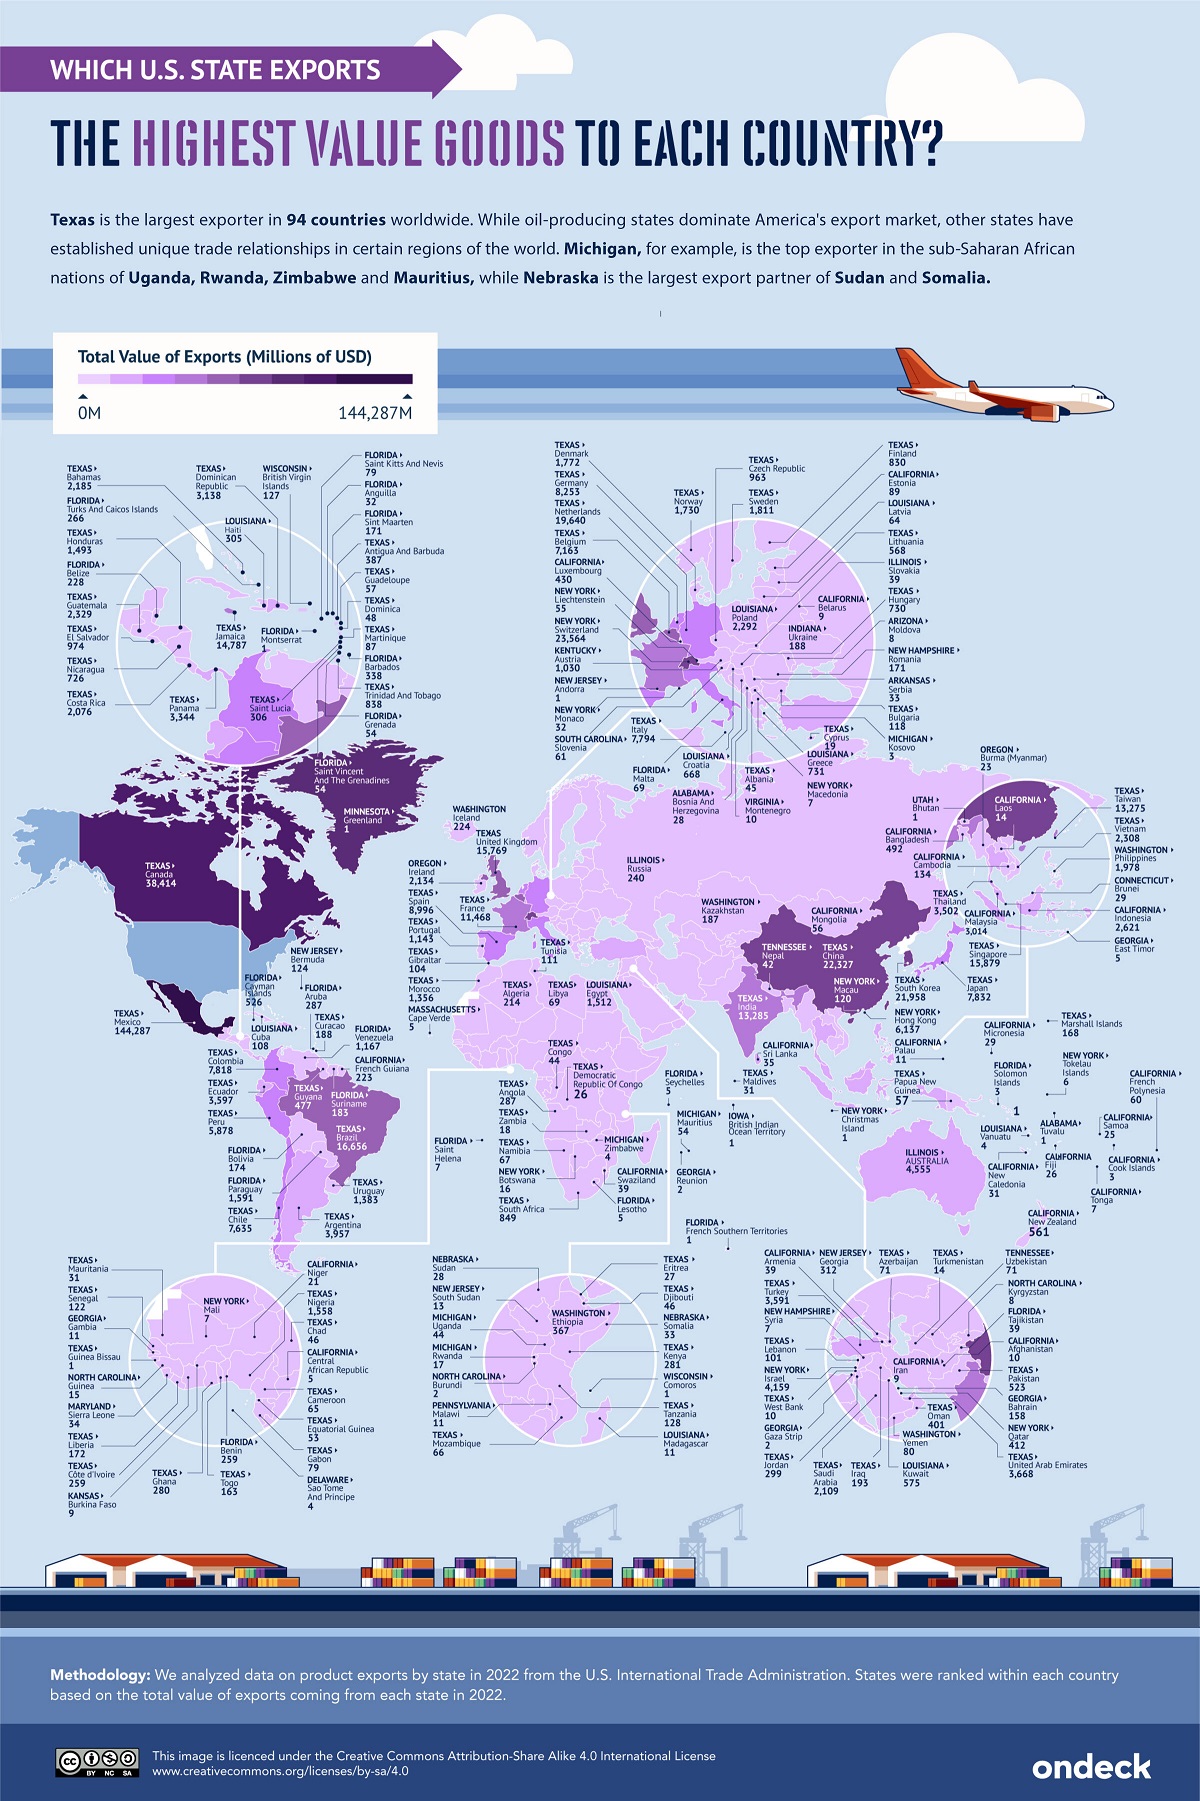
The U.S. State that Each Country Trades With the Most
The U.S. is the world’s second-largest exporter, just behind China. In 2022 alone, America exported some $2.1 trillion, accounting for 8.4% of global exports.
In this graphic by OnDeck, we show the U.S. state that each country receives the most exports from, using data from the U.S. International Trade Administration.
Texas is the Top Exporter
Texas is the leading U.S. exporter to major global economies. The state leads in 94 countries, including Canada, China, the U.K., and Germany. Texas is followed by California (25 countries) and Florida (24 countries).
| State | 2023 Exports (Millions) |
|---|---|
| Texas | $444,608 |
| California | $178,717 |
| Louisiana | $100,197 |
| New York | $97,828 |
| Illinois | $78,724 |
| Unallocated | $73,829 |
| Florida | $68,899 |
| Michigan | $64,904 |
| Washington | $61,209 |
| Indiana | $56,081 |
| Ohio | $55,764 |
| Pennsylvania | $52,876 |
| Georgia | $49,772 |
| New Jersey | $43,334 |
| North Carolina | $42,223 |
| Kentucky | $40,212 |
| Tennessee | $38,120 |
| South Carolina | $37,297 |
| Massachusetts | $35,221 |
| Arizona | $28,791 |
| Wisconsin | $28,021 |
| Oregon | $27,718 |
| Alabama | $27,447 |
| Minnesota | $24,920 |
| Puerto Rico | $22,493 |
| Virginia | $22,395 |
| Iowa | $18,439 |
| Maryland | $18,360 |
| Missouri | $17,858 |
| Utah | $17,388 |
| Connecticut | $15,825 |
| Mississippi | $14,305 |
| Kansas | $14,148 |
| Colorado | $10,378 |
| Nevada | $9,533 |
| Nebraska | $7,987 |
| New Hampshire | $7,638 |
| North Dakota | $7,520 |
| Oklahoma | $6,511 |
| Arkansas | $6,450 |
| West Virginia | $5,652 |
| Alaska | $5,244 |
| New Mexico | $4,940 |
| Delaware | $4,921 |
| Idaho | $4,011 |
| Virgin Islands | $3,403 |
| Rhode Island | $3,016 |
| Maine | $2,951 |
| South Dakota | $2,399 |
| Montana | $2,231 |
| Wyoming | $2,143 |
| Vermont | $1,991 |
| District of Columbia | $1,746 |
| Hawaii | $570 |
Exports from Texas to Mexico have an annual value of $144.29 billion—the highest value of exports from a U.S. state to any country. From this total, Texas exports $33.63 billion in Petroleum & Coal Products to Mexico yearly, the highest value of any single product category from a state to another country.
While oil-producing states like Texas, New Mexico, and North Dakota dominate America’s export market, other states have established unique trade relationships in some regions.
Michigan, for example, exports $15.37 billion in Transportation Equipment to Canada. These include passenger vehicles and trucks, as well as parts.
Australia imports $4.56 billion in goods from Illinois each year, more than from any other U.S. state.
New York State’s exports to Switzerland reached $23.56 billion in 2022. Over three-quarters of this trade is in the category of Primary Metal Manufactures, which includes upstream metal products such as closures, castings, pipes, tubes, wires, and springs.
Hong Kong also counts New York as the state from which it imports the most.

This article was published as a part of Visual Capitalist's Creator Program, which features data-driven visuals from some of our favorite Creators around the world.


Maps
Mapped: The 10 U.S. States With the Lowest Real GDP Growth
In this graphic, we show where real GDP lagged the most across America in 2023 as high interest rates weighed on state economies.


The Top 10 U.S. States, by Lowest Real GDP Growth
This was originally posted on our Voronoi app. Download the app for free on iOS or Android and discover incredible data-driven charts from a variety of trusted sources.
While the U.S. economy defied expectations in 2023, posting 2.5% in real GDP growth, several states lagged behind.
Last year, oil-producing states led the pack in terms of real GDP growth across America, while the lowest growth was seen in states that were more sensitive to the impact of high interest rates, particularly due to slowdowns in the manufacturing and finance sectors.
This graphic shows the 10 states with the least robust real GDP growth in 2023, based on data from the Bureau of Economic Analysis.
Weakest State Economies in 2023
Below, we show the states with the slowest economic activity in inflation-adjusted terms, using chained 2017 dollars:
| Rank | State | Real GDP Growth 2023 YoY | Real GDP 2023 |
|---|---|---|---|
| 1 | Delaware | -1.2% | $74B |
| 2 | Wisconsin | +0.2% | $337B |
| 3 | New York | +0.7% | $1.8T |
| 4 | Missississippi | +0.7% | $115B |
| 5 | Georgia | +0.8% | $661B |
| 6 | Minnesota | +1.2% | $384B |
| 7 | New Hampshire | +1.2% | $91B |
| 8 | Ohio | +1.2% | $698B |
| 9 | Iowa | +1.3% | $200B |
| 10 | Illinois | +1.3% | $876B |
| U.S. | +2.5% | $22.4T |
Delaware witnessed the slowest growth in the country, with real GDP growth of -1.2% over the year as a sluggish finance and insurance sector dampened the state’s economy.
Like Delaware, the Midwestern state of Wisconsin also experienced declines across the finance and insurance sector, in addition to steep drops in the agriculture and manufacturing industries.
America’s third-biggest economy, New York, grew just 0.7% in 2023, falling far below the U.S. average. High interest rates took a toll on key sectors, with notable slowdowns in the construction and manufacturing sectors. In addition, falling home prices and a weaker job market contributed to slower economic growth.
Meanwhile, Georgia experienced the fifth-lowest real GDP growth rate. In March 2024, Rivian paused plans to build a $5 billion EV factory in Georgia, which was set to be one of the biggest economic development initiatives in the state in history.
These delays are likely to exacerbate setbacks for the state, however, both Kia and Hyundai have made significant investments in the EV industry, which could help boost Georgia’s manufacturing sector looking ahead.

-

 Personal Finance1 week ago
Visualizing the Tax Burden of Every U.S. State
-

 Misc7 days ago
Visualized: Aircraft Carriers by Country
-

 Culture1 week ago
How Popular Snack Brand Logos Have Changed
-

 Mining1 week ago
Visualizing Copper Production by Country in 2023
-

 Misc1 week ago
Charted: How Americans Feel About Federal Government Agencies
-

 Healthcare1 week ago
Which Countries Have the Highest Infant Mortality Rates?
-

 Demographics1 week ago
Mapped: U.S. Immigrants by Region
-

 Maps1 week ago
Mapped: Southeast Asia’s GDP Per Capita, by Country