Markets
Visualizing Every Company on the S&P 500 Index
Subscribe to the Advisor Channel free mailing list for more like this
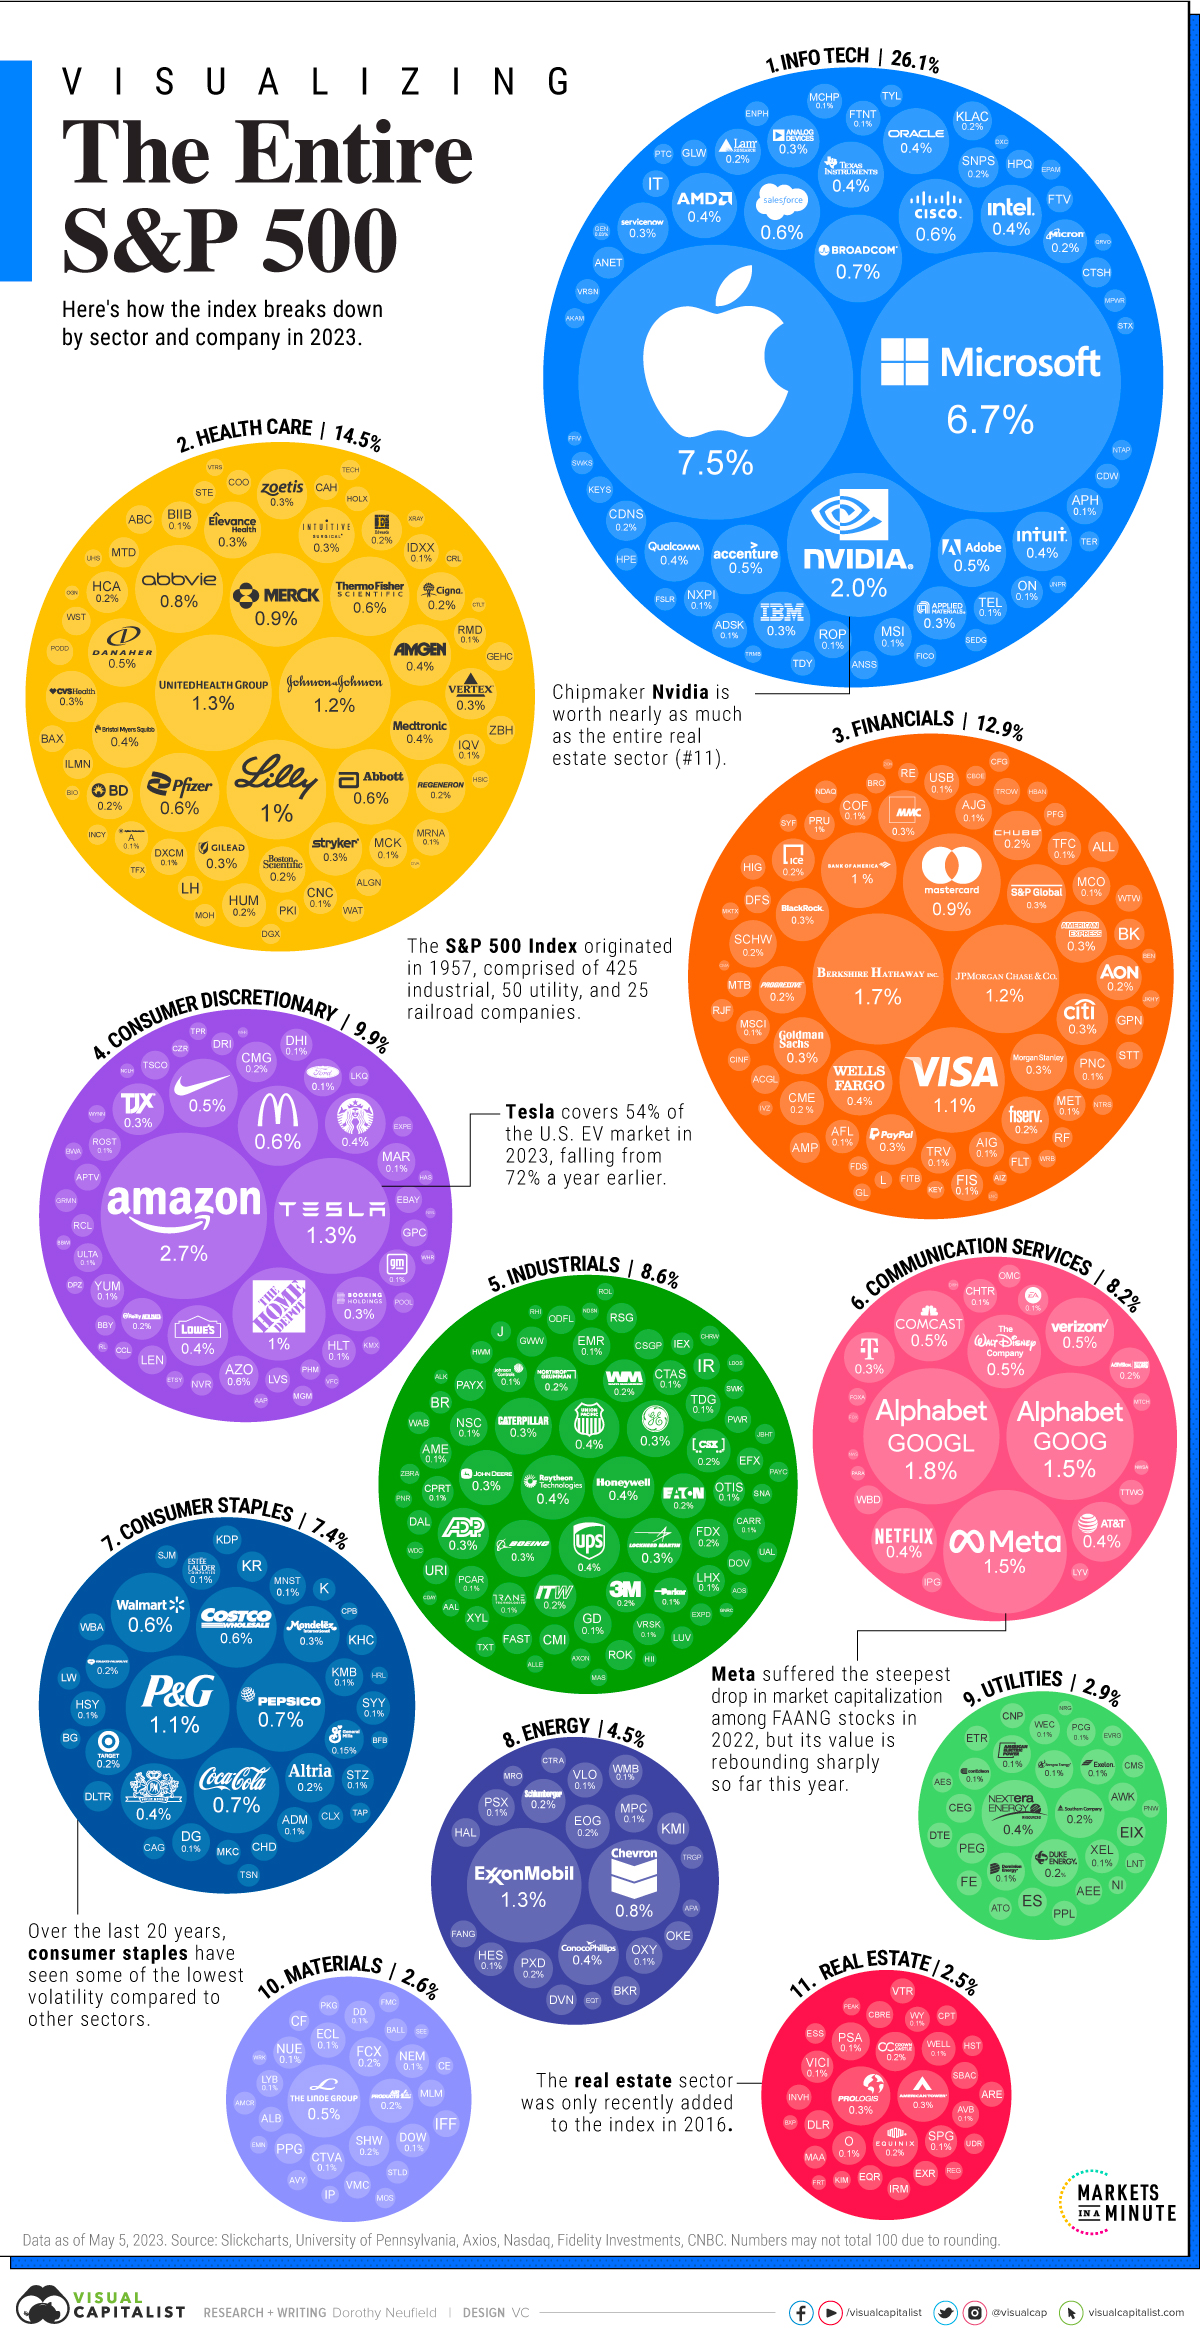
S&P 500 Companies: A Complete Visual Breakdown
This was originally posted on Advisor Channel. Sign up to the free mailing list to get beautiful visualizations on financial markets that help advisors and their clients.
S&P 500 companies hold $7.1 trillion in assets, and account for close to 80% of available market capitalization on U.S. stock exchanges.
The index serves as a barometer for the U.S. stock market, covering the largest public U.S. companies by market capitalization. Often, it reflects investor sentiment and is considered an indicator for U.S. economic health.
As the S&P 500 enters a bull market after the longest downturn in decades, the above graphic shows the entire makeup of one of the world’s largest markets.
Top S&P 500 Companies, by Weight
Here are the 100 biggest S&P 500 companies by sector and weight, using data from Slickcharts. Data is as of May 5, 2023.
Rank, by Weight | Name | Sector | Weight (%) |
|---|---|---|---|
| 1 | Apple | Info Tech | 7.46 |
| 2 | Microsoft | Info Tech | 6.69 |
| 3 | Amazon.com | Consumer Discretionary | 2.72 |
| 4 | Nvidia | Info Tech | 2.04 |
| 5 | Alphabet Inc. Class A | Communication Services | 1.82 |
| 6 | Berkshire Hathaway | Financials | 1.69 |
| 7 | Alphabet Inc. Class C | Communication Services | 1.59 |
| 8 | Meta Platforms | Communication Services | 1.50 |
| 9 | UnitedHealth Group | Health Care | 1.34 |
| 10 | Tesla | Consumer Discretionary | 1.32 |
| 11 | Exxon Mobil | Energy | 1.29 |
| 12 | Johnson & Johnson | Health Care | 1.23 |
| 13 | JPMorgan Chase | Financials | 1.16 |
| 14 | Visa | Financials | 1.09 |
| 15 | Procter & Gamble | Consumer Staples | 1.06 |
| 16 | Eli Lilly | Health Care | 0.98 |
| 17 | Mastercard | Financials | 0.94 |
| 18 | Merck & Co. | Health Care | 0.86 |
| 19 | Home Depot | Consumer Discretionary | 0.85 |
| 20 | Chevron | Energy | 0.82 |
| 21 | PepsiCo | Consumer Staples | 0.77 |
| 22 | Broadcom | Info Tech | 0.76 |
| 23 | AbbVie | Health Care | 0.76 |
| 24 | Coca-Cola | Consumer Staples | 0.72 |
| 25 | Costco | Consumer Staples | 0.64 |
| 26 | McDonald's | Consumer Discretionary | 0.63 |
| 27 | Pfizer | Health Care | 0.62 |
| 28 | Thermo Fisher Scientific | Health Care | 0.62 |
| 29 | Walmart | Consumer Staples | 0.62 |
| 30 | Salesforce | Info Tech | 0.57 |
| 31 | Abbott Laboratories | Health Care | 0.56 |
| 32 | Bank of America | Financials | 0.56 |
| 33 | Cisco Systems | Info Tech | 0.55 |
| 34 | Walt Disney Company | Communication Services | 0.53 |
| 35 | Linde plc | Materials | 0.52 |
| 36 | Comcast Corporation | Communication Services | 0.49 |
| 37 | Accenture | Info Tech | 0.48 |
| 38 | Adobe | Info Tech | 0.46 |
| 39 | Danaher | Health Care | 0.46 |
| 40 | Verizon | Communication Services | 0.46 |
| 41 | NIKE | Consumer Discretionary | 0.46 |
| 42 | Texas Instruments | Info Tech | 0.43 |
| 43 | NextEra Energy | Utilities | 0.43 |
| 44 | Oracle | Info Tech | 0.43 |
| 45 | Philip Morris | Consumer Staples | 0.43 |
| 46 | Bristol-Myers Squibb | Health Care | 0.42 |
| 47 | Advanced Micro Devices | Info Tech | 0.42 |
| 48 | Wells Fargo | Financials | 0.42 |
| 49 | Netflix | Communication Services | 0.42 |
| 50 | Raytheon Technologies | Industrials | 0.41 |
| 51 | Honeywell | Industrials | 0.38 |
| 52 | United Parcel Service | Industrials | 0.37 |
| 53 | Intel | Info Tech | 0.37 |
| 54 | Amgen | Health Care | 0.37 |
| 55 | Lowe's | Consumer Discretionary | 0.36 |
| 56 | Starbucks | Consumer Discretionary | 0.36 |
| 57 | Union Pacific | Industrials | 0.36 |
| 58 | ConocoPhillips | Energy | 0.36 |
| 59 | AT&T | Communication Services | 0.35 |
| 60 | QUALCOMM | Info Tech | 0.35 |
| 61 | Intuit Inc. | Info Tech | 0.35 |
| 62 | Medtronic Plc | Health Care | 0.35 |
| 63 | Prologis Inc. | Real Estate | 0.34 |
| 64 | S&P Global | Financials | 0.34 |
| 65 | Caterpillar | Industrials | 0.32 |
| 66 | International Business Machines | Info Tech | 0.32 |
| 67 | Boeing | Industrials | 0.32 |
| 68 | Elevance Health | Health Care | 0.32 |
| 69 | Morgan Stanley | Financials | 0.32 |
| 70 | Goldman Sachs Group | Financials | 0.32 |
| 71 | General Electric | Industrials | 0.32 |
| 72 | Intuitive Surgical | Health Care | 0.31 |
| 73 | Mondelez International | Consumer Staples | 0.31 |
| 74 | Lockheed Martin | Industrials | 0.30 |
| 75 | Deere & Company | Industrials | 0.30 |
| 76 | Booking Holdings | Consumer Discretionary | 0.29 |
| 77 | Gilead Sciences | Health Care | 0.29 |
| 78 | Applied Materials | Info Tech | 0.28 |
| 79 | BlackRock | Financials | 0.28 |
| 80 | Stryker | Health Care | 0.28 |
| 81 | Analog Devices | Info Tech | 0.27 |
| 82 | American Tower | Real Estate | 0.26 |
| 83 | American Express | Financials | 0.26 |
| 84 | CVS Health | Health Care | 0.26 |
| 85 | TJX Companies | Consumer Discretionary | 0.26 |
| 86 | Citigroup | Financials | 0.26 |
| 87 | Vertex Pharmaceuticals | Health Care | 0.26 |
| 88 | Automatic Data Processing | Industrials | 0.26 |
| 89 | Marsh & McLennan Companies | Financials | 0.26 |
| 90 | ServiceNow | Info Tech | 0.26 |
| 91 | Zoetis | Health Care | 0.25 |
| 92 | T-Mobile | Communication Services | 0.25 |
| 93 | PayPal | Financials | 0.25 |
| 94 | Altria Group | Consumer Staples | 0.24 |
| 95 | Chubb | Financials | 0.24 |
| 96 | Regeneron Pharmaceuticals | Health Care | 0.24 |
| 97 | Southern Company | Utilities | 0.24 |
| 98 | Cigna | Health Care | 0.23 |
| 99 | Duke Energy | Utilities | 0.22 |
| 100 | Fiserv | Financials | 0.22 |
Over the last decade, big tech names have dominated the index.
The tech sector makes up over 26%, with Apple, Microsoft, and Nvidia as the top S&P 500 companies by market capitalization. Despite interest rates climbing at warp speed, a select number of big tech names have maintained, or even expanded their influence on the index over the last year.
In many cases, investor demand for AI-related stocks has fueled these increases.
Amazon is the third-largest company in the index. While shares tumbled in 2022 amid slowing sales, they have since rebounded by about 46% this year. Like Amazon, consumer discretionary firm Tesla has seen a strong reversal as the index’s 10th biggest stock by weight.
In the financial sector, Berkshire Hathaway has the highest weight (1.7%) while UnitedHealth Group (1.3%) is the top in health care. The health conglomerate even towers above JP Morgan Chase, the biggest bank in America.
S&P 500 Sectors and the Market Cycle
Below, we show the 11 sectors in the S&P 500, organized by weight and their typical performance over the business cycle:
- Cyclical: Rise and fall with the market cycle, often correlated to expansions or contractions
- Defensive: Typically are negatively correlated to the market cycle, with more stable earnings and dividends
| Sector | Weight | Type |
|---|---|---|
| Information Technology | 26.1% | Cyclical |
| Health Care | 14.5% | Defensive |
| Financials | 12.9% | Cyclical |
| Consumer Discretionary | 9.9% | Cyclical |
| Industrials | 8.6% | Cyclical |
| Communication Services | 8.2% | Cyclical |
| Consumer Staples | 7.4% | Defensive |
| Energy | 4.5% | Defensive |
| Utilities | 2.9% | Defensive |
| Materials | 2.6% | Cyclical |
| Real Estate | 2.5% | Cyclical |
Numbers may not total 100 due to rounding.
Information technology, health care, and financials have the highest share in the S&P 500. Together, they cover over half the index.
S&P 500 Companies: Mixed Signals in 2023
In many ways there are two major themes playing out this year so far for U.S. equities, which is the best-performing asset class year to date.
First is that seven big tech companies—Apple, Microsoft, Nvidia, Google, Tesla, Meta, and Amazon—are driving virtually all of the index’s gains. These companies have seen double or triple-digit returns this year so far. As of May 31, tech sector ETFs saw $8 billion in inflows to date, the highest across any sector.
Secondly, the energy and health care sectors have seen the highest outflows, at $9 billion and $4 billion, respectively.
Even with interest rates hitting 15-year highs, extreme greed is in the market, based on the Fear and Greed Index. This may signal higher risk in the S&P 500, since a hit to these few companies with high weightings could significantly affect the broader index.


Maps
Mapped: The 10 U.S. States With the Lowest Real GDP Growth
In this graphic, we show where real GDP lagged the most across America in 2023 as high interest rates weighed on state economies.


The Top 10 U.S. States, by Lowest Real GDP Growth
This was originally posted on our Voronoi app. Download the app for free on iOS or Android and discover incredible data-driven charts from a variety of trusted sources.
While the U.S. economy defied expectations in 2023, posting 2.5% in real GDP growth, several states lagged behind.
Last year, oil-producing states led the pack in terms of real GDP growth across America, while the lowest growth was seen in states that were more sensitive to the impact of high interest rates, particularly due to slowdowns in the manufacturing and finance sectors.
This graphic shows the 10 states with the least robust real GDP growth in 2023, based on data from the Bureau of Economic Analysis.
Weakest State Economies in 2023
Below, we show the states with the slowest economic activity in inflation-adjusted terms, using chained 2017 dollars:
| Rank | State | Real GDP Growth 2023 YoY | Real GDP 2023 |
|---|---|---|---|
| 1 | Delaware | -1.2% | $74B |
| 2 | Wisconsin | +0.2% | $337B |
| 3 | New York | +0.7% | $1.8T |
| 4 | Missississippi | +0.7% | $115B |
| 5 | Georgia | +0.8% | $661B |
| 6 | Minnesota | +1.2% | $384B |
| 7 | New Hampshire | +1.2% | $91B |
| 8 | Ohio | +1.2% | $698B |
| 9 | Iowa | +1.3% | $200B |
| 10 | Illinois | +1.3% | $876B |
| U.S. | +2.5% | $22.4T |
Delaware witnessed the slowest growth in the country, with real GDP growth of -1.2% over the year as a sluggish finance and insurance sector dampened the state’s economy.
Like Delaware, the Midwestern state of Wisconsin also experienced declines across the finance and insurance sector, in addition to steep drops in the agriculture and manufacturing industries.
America’s third-biggest economy, New York, grew just 0.7% in 2023, falling far below the U.S. average. High interest rates took a toll on key sectors, with notable slowdowns in the construction and manufacturing sectors. In addition, falling home prices and a weaker job market contributed to slower economic growth.
Meanwhile, Georgia experienced the fifth-lowest real GDP growth rate. In March 2024, Rivian paused plans to build a $5 billion EV factory in Georgia, which was set to be one of the biggest economic development initiatives in the state in history.
These delays are likely to exacerbate setbacks for the state, however, both Kia and Hyundai have made significant investments in the EV industry, which could help boost Georgia’s manufacturing sector looking ahead.

-

 Personal Finance1 week ago
Visualizing the Tax Burden of Every U.S. State
-

 Misc6 days ago
Visualized: Aircraft Carriers by Country
-

 Culture6 days ago
How Popular Snack Brand Logos Have Changed
-

 Mining1 week ago
Visualizing Copper Production by Country in 2023
-

 Misc1 week ago
Charted: How Americans Feel About Federal Government Agencies
-

 Healthcare1 week ago
Which Countries Have the Highest Infant Mortality Rates?
-

 Demographics1 week ago
Mapped: U.S. Immigrants by Region
-

 Maps1 week ago
Mapped: Southeast Asia’s GDP Per Capita, by Country