Energy
Visualizing the Biggest Risks to the Global Economy in 2020
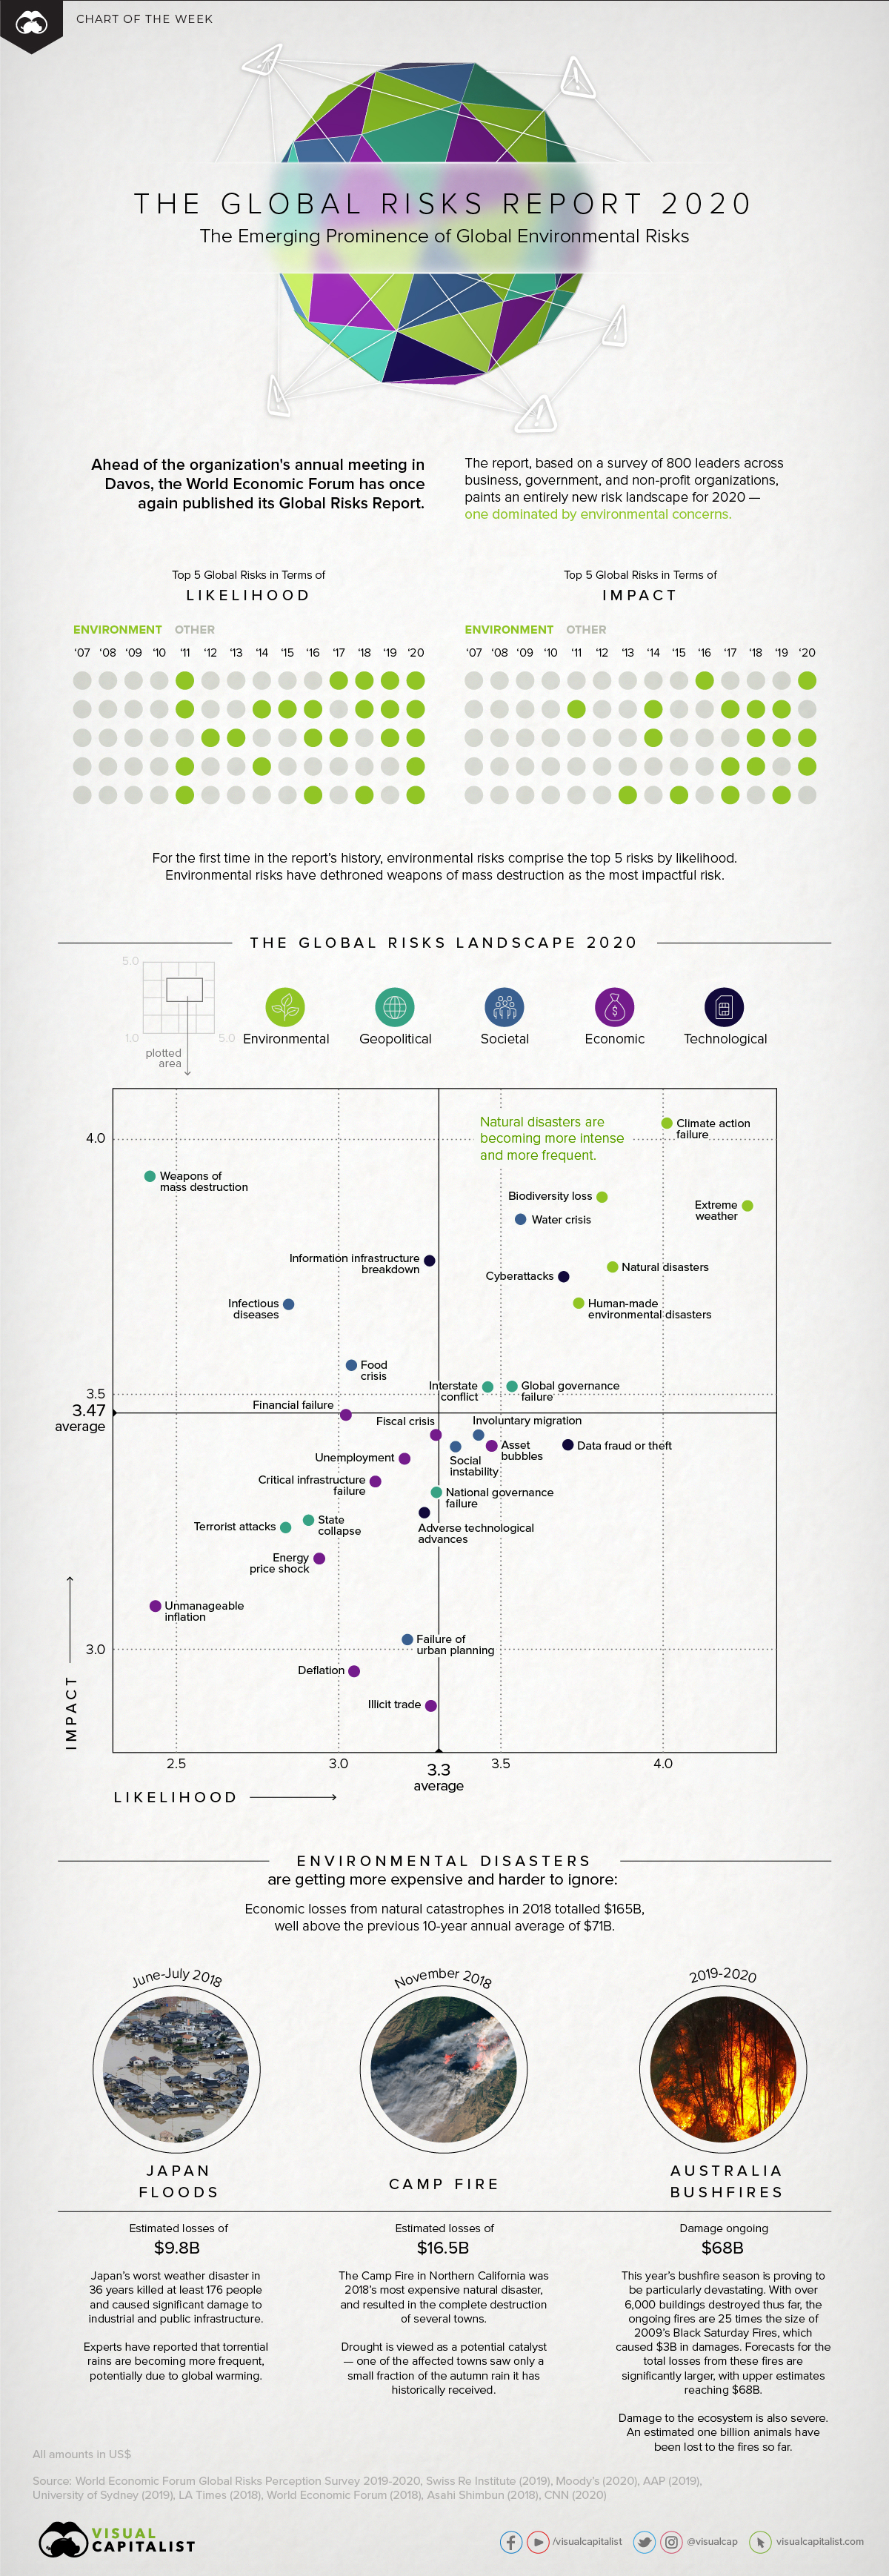
Top Risks in 2020: Dominated by Environmental Factors
Environmental concerns are a frequent talking point drawn upon by politicians and scientists alike, and for good reason. Irrespective of economic or social status, climate change has the potential to affect us all.
While public urgency surrounding climate action has been growing, it can be difficult to comprehend the potential extent of economic disruption that environmental risks pose.
Front and Center
Today’s chart uses data from the World Economic Forum’s annual Global Risks Report, which surveyed 800 leaders from business, government, and non-profits to showcase the most prominent economic risks the world faces.
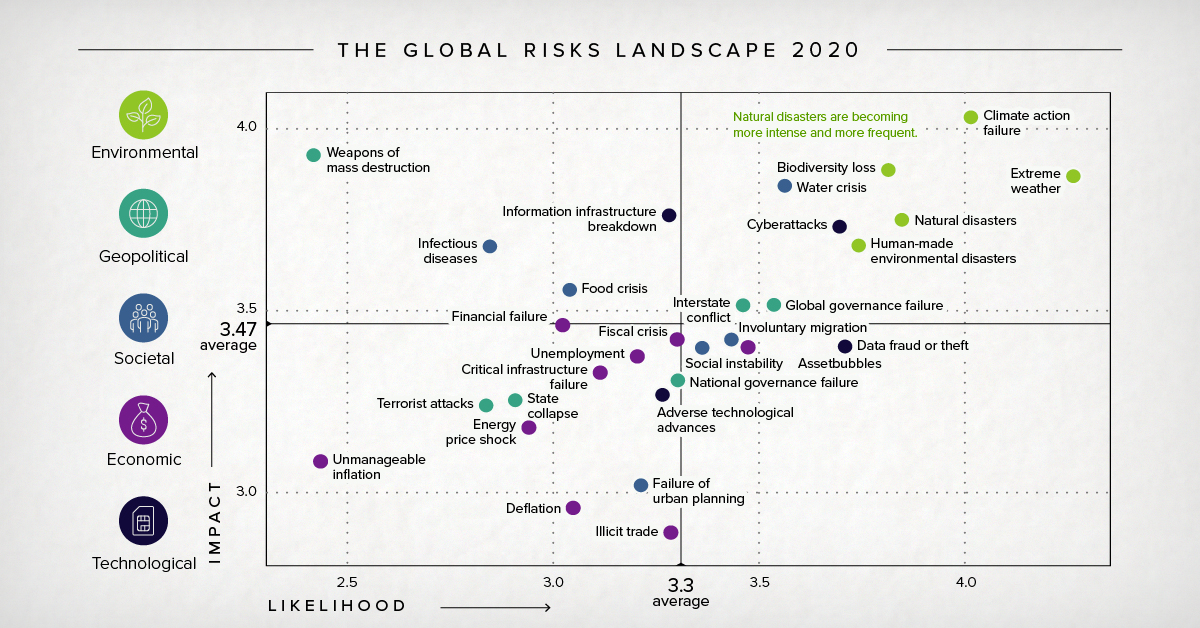
According to the data in the report, here are the top five risks to the global economy, in terms of their likelihood and potential impact:
| Top Global Risks (by "Likelihood") | Top Global Risks (by "Impact") | |||
|---|---|---|---|---|
| #1 | Extreme weather | #1 | Climate action failure | |
| #2 | Climate action failure | #2 | Weapons of mass destruction | |
| #3 | Natural disasters | #3 | Biodiversity loss | |
| #4 | Biodiversity loss | #4 | Extreme weather | |
| #5 | Humanmade environmental disasters | #5 | Water crises | |
With more emphasis being placed on environmental risks, how much do we need to worry?
According to the World Economic Forum, more than we can imagine. The report asserts that, among many other things, natural disasters are becoming more intense and more frequent.
While it can be difficult to extrapolate precisely how environmental risks could cascade into trouble for the global economy and financial system, here are some interesting examples of how they are already affecting institutional investors and the insurance industry.
The Stranded Assets Dilemma
If the world is to stick to its 2°C global warming threshold, as outlined in the Paris Agreement, a significant amount of oil, gas, and coal reserves would need to be left untouched. These assets would become “stranded”, forfeiting roughly $1-4 trillion from the world economy.
Growing awareness of this risk has led to a change in sentiment. Many institutional investors have become wary of their portfolio exposures, and in some cases, have begun divesting from the sector entirely.
The financial case for fossil fuel divestment is strong. Fossil fuel companies once led the economy and world stock markets. They now lag.
– Institute for Energy Economics and Financial Analysis
The last couple of years have been a game-changer for the industry’s future prospects. For example, 2018 was a milestone year in fossil fuel divestment:
- Nearly 1,000 institutional investors representing $6.24 trillion in assets have pledged to divest from fossil fuels, up from just $52 billion four years ago;
- Ireland became the first country to commit to fossil fuel divestment. At the time of announcement, its sovereign development fund had $10.4 billion in assets;
- New York City became the largest (but not the first) city to commit to fossil fuel divestment. Its pension funds, totaling $189 billion at the time of announcement, aim to divest over a 5-year period.
A Tough Road Ahead
In a recent survey, actuaries ranked climate change as their top risk for 2019, ahead of damages from cyberattacks, financial instability, and terrorism—drawing strong parallels with the results of this year’s Global Risk Report.
These growing concerns are well-founded. 2017 was the costliest year on record for natural disasters, with $344 billion in global economic losses. This daunting figure translated to a record year for insured losses, totalling $140 billion.
Although insured losses over 2019 have fallen back in line with the average over the past 10 years, Munich RE believes that long-term environmental effects are already being felt:
- Recent studies have shown that over the long term, the environmental conditions for bushfires in Australia have become more favorable;
- Despite a decrease in U.S. wildfire losses compared to previous years, there is a rising long-term trend for forest area burned in the U.S.;
- An increase in hailstorms, as a result of climate change, has been shown to contribute to growing losses across the globe.
The Ball Is In Our Court
It’s clear that the environmental issues we face are beginning to have a larger real impact. Despite growing awareness and preliminary actions such as fossil fuel divestment, the Global Risk Report stresses that there is much more work to be done to mitigate risks.
How companies and governments choose to respond over the next decade will be a focal point of many discussions to come.


Who’s Building the Most Solar Energy?
This was originally posted on our Voronoi app. Download the app for free on iOS or Android and discover incredible data-driven charts from a variety of trusted sources.
In 2023, solar energy accounted for three-quarters of renewable capacity additions worldwide. Most of this growth occurred in Asia, the EU, and the U.S., continuing a trend observed over the past decade.
In this graphic, we illustrate the rise in installed solar photovoltaic (PV) capacity in China, the EU, and the U.S. between 2010 and 2022, measured in gigawatts (GW). Bruegel compiled the data..
Chinese Dominance
As of 2022, China’s total installed capacity stands at 393 GW, nearly double that of the EU’s 205 GW and surpassing the USA’s total of 113 GW by more than threefold in absolute terms.
| Installed solar capacity (GW) | China | EU27 | U.S. |
|---|---|---|---|
| 2022 | 393.0 | 205.5 | 113.0 |
| 2021 | 307.0 | 162.7 | 95.4 |
| 2020 | 254.0 | 136.9 | 76.4 |
| 2019 | 205.0 | 120.1 | 61.6 |
| 2018 | 175.3 | 104.0 | 52.0 |
| 2017 | 130.8 | 96.2 | 43.8 |
| 2016 | 77.8 | 91.5 | 35.4 |
| 2015 | 43.6 | 87.7 | 24.2 |
| 2014 | 28.4 | 83.6 | 18.1 |
| 2013 | 17.8 | 79.7 | 13.3 |
| 2012 | 6.7 | 71.1 | 8.6 |
| 2011 | 3.1 | 53.3 | 5.6 |
| 2010 | 1.0 | 30.6 | 3.4 |
Since 2017, China has shown a compound annual growth rate (CAGR) of approximately 25% in installed PV capacity, while the USA has seen a CAGR of 21%, and the EU of 16%.
Additionally, China dominates the production of solar power components, currently controlling around 80% of the world’s solar panel supply chain.
In 2022, China’s solar industry employed 2.76 million individuals, with manufacturing roles representing approximately 1.8 million and the remaining 918,000 jobs in construction, installation, and operations and maintenance.
The EU industry employed 648,000 individuals, while the U.S. reached 264,000 jobs.
According to the IEA, China accounts for almost 60% of new renewable capacity expected to become operational globally by 2028.
Despite the phasing out of national subsidies in 2020 and 2021, deployment of solar PV in China is accelerating. The country is expected to reach its national 2030 target for wind and solar PV installations in 2024, six years ahead of schedule.

-

 Personal Finance1 week ago
Visualizing the Tax Burden of Every U.S. State
-

 Misc6 days ago
Visualized: Aircraft Carriers by Country
-

 Culture7 days ago
How Popular Snack Brand Logos Have Changed
-

 Mining1 week ago
Visualizing Copper Production by Country in 2023
-

 Misc1 week ago
Charted: How Americans Feel About Federal Government Agencies
-

 Healthcare1 week ago
Which Countries Have the Highest Infant Mortality Rates?
-

 Demographics1 week ago
Mapped: U.S. Immigrants by Region
-

 Maps1 week ago
Mapped: Southeast Asia’s GDP Per Capita, by Country