Mapped: The 10 U.S. States With the Lowest Real GDP Growth
Ranked: The World’s 50 Largest Private Equity Firms
Top 10 Countries Most in Debt to the IMF
Ranked: The Top 6 Economies by Share of Global GDP (1980-2024)
Mapped: Europe’s GDP Per Capita, by Country
Countries With the Highest Rates of Crypto Ownership
Mapped: The Number of AI Startups By Country
All of the Grants Given by the U.S. CHIPS Act
Visualizing AI Patents by Country
How Tech Logos Have Evolved Over Time
Visualizing America’s Average Retirement Savings, by Age
Visualizing the Tax Burden of Every U.S. State
Charted: What Frustrates Americans About the Tax System
Ranked: The Top 20 Countries in Debt to China
Mapped: Countries Where Recreational Cannabis is Legal
Which Countries Have the Highest Infant Mortality Rates?
Life Expectancy by Region (1950-2050F)
What Causes Preventable Child Deaths?
The Cost of an EpiPen in Major Markets
Who’s Building the Most Solar Energy?
Mapped: The Age of Energy Projects in Interconnection Queues, by State
Ranked: The Top 10 EV Battery Manufacturers in 2023
The World’s Biggest Nuclear Energy Producers
The World’s Biggest Oil Producers in 2023
Mapped: The Top Exports in Asian Countries
Mapped: U.S. States By Number of Cities Over 250,000 Residents
Mapped: U.S. Immigrants by Region
The Biggest Salt Producing Countries in 2023
Visualizing Copper Production by Country in 2023
Where the World’s Aluminum is Smelted, by Country
Visualizing Global Gold Production in 2023
How People Get Around in America, Europe, and Asia
The Carbon Footprint of Major Travel Methods
Ranking the Top 15 Countries by Carbon Tax Revenue
Ranked: The Countries With the Most Air Pollution in 2023
Top Countries By Forest Growth Since 2001
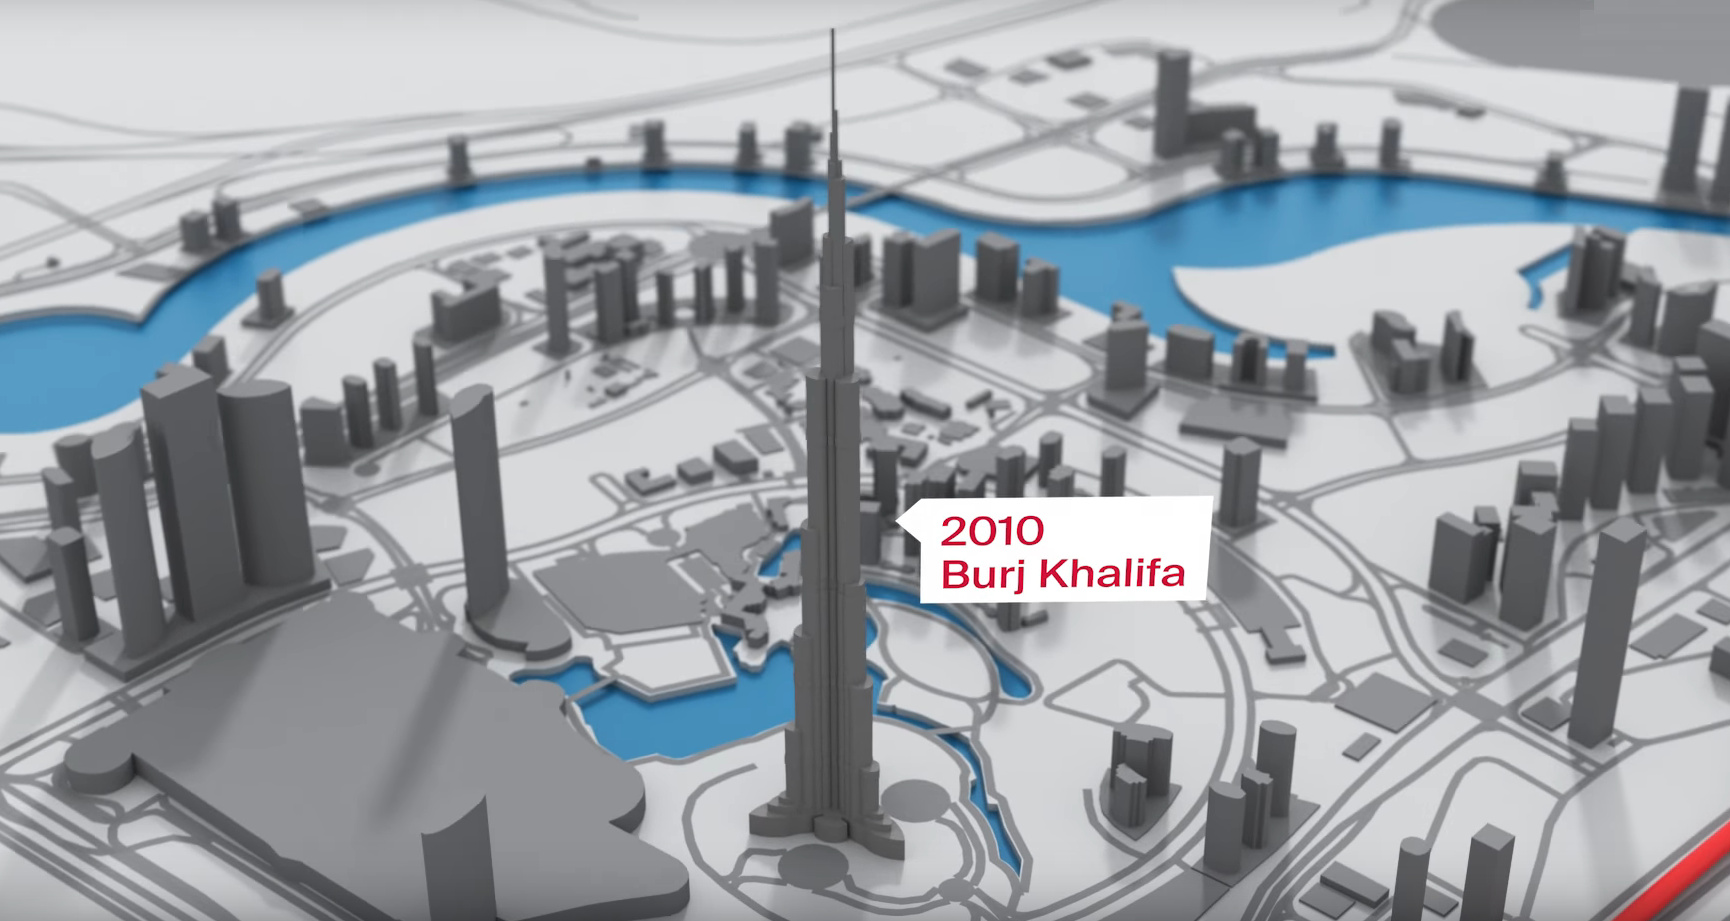
In just a half-century, Dubai has gone from a fishing village to a global real estate hub. Today's video and graphic track the city's stunning transformation.
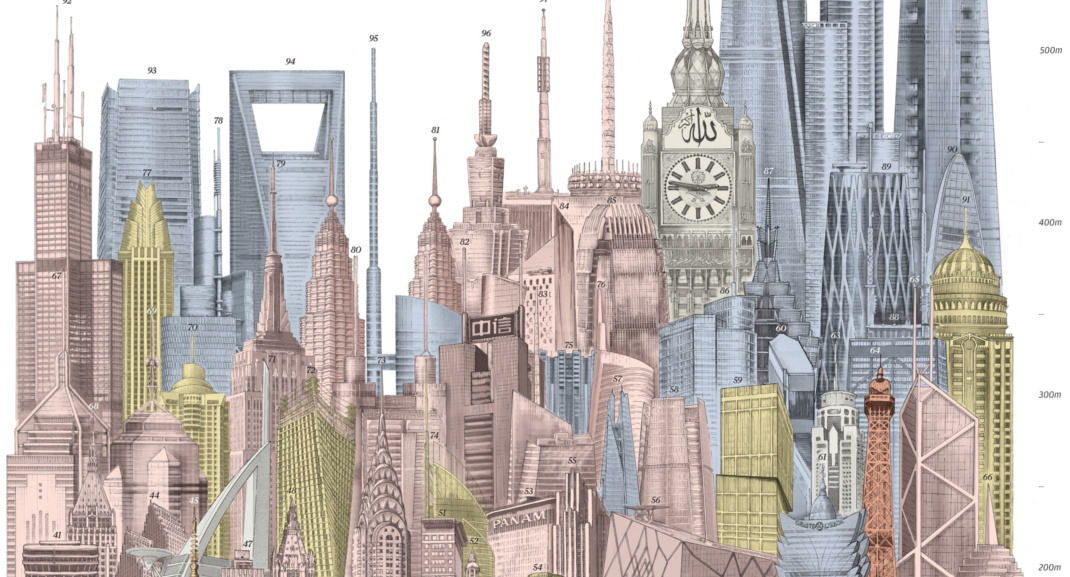
Today's visualization demonstrates the mind-bending scale of the newest generation of megatall skyscrapers. The stage is set for a global skyscraper boom.
This infographic highlights the 10 cities where international travelers spend the most. In 2022, Dubai took top spot.
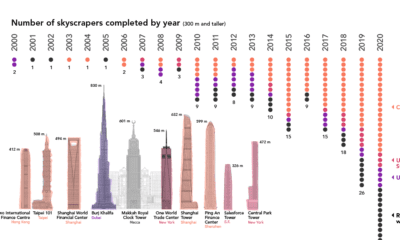
Once a rarity, supertall skyscrapers now punctuate the skylines of cities around the world. We chart the construction of these structures over the past 20 years
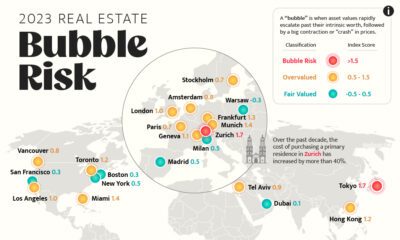
Despite higher mortgages and sharply correcting prices, some cities’ property markets are still in bubble-risk territory.
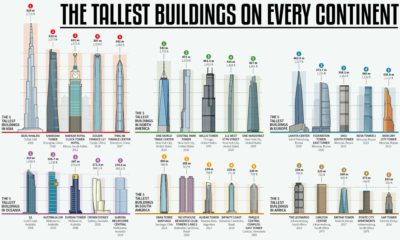
How much higher and further into the skies can we reach? This infographic looks at the most impressive skyscrapers gracing every continent.
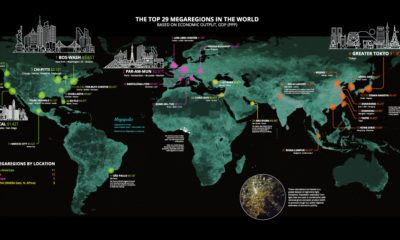
Today’s stunning map ranks the world’s most powerful megaregions — together, they contribute a whopping $28 trillion to the global economy.
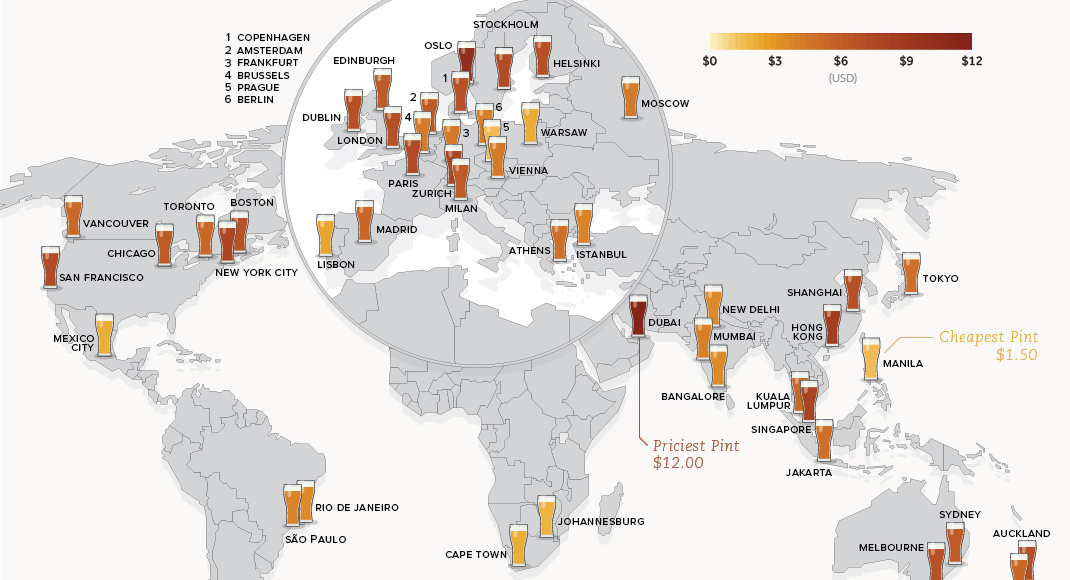
This data on the price of beer is fresh from the tap. See how much a pint of beer costs in 48 different major cities around...
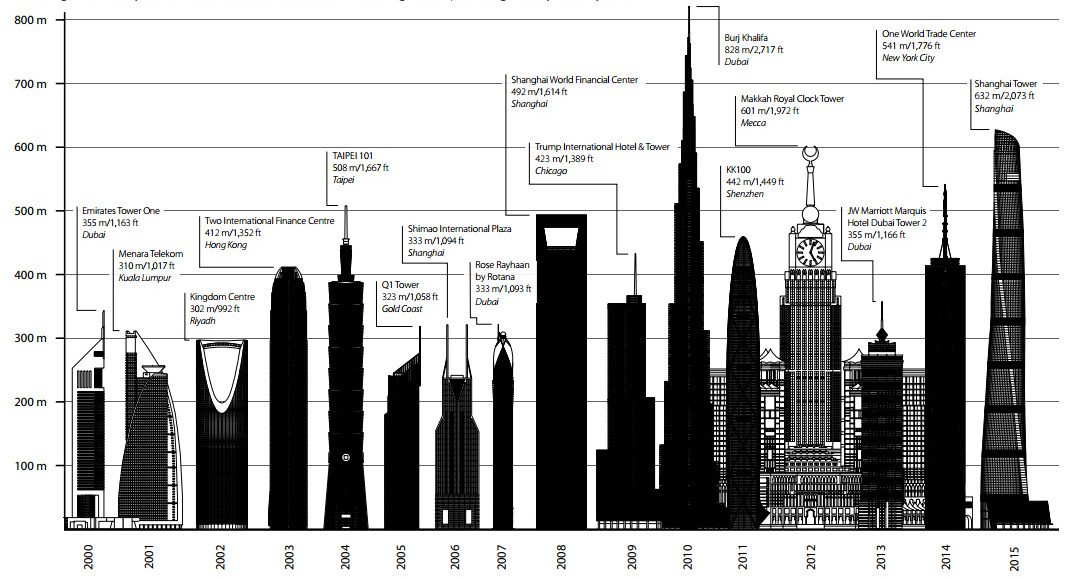
These visualizations show how the tallest skyscraper of 2015 compares to other years, as well as other buildings completed last year.
In this graphic, we show the highest earning flight routes globally as air travel continued to rebound in 2023.