Energy
2024 U.S. Clean Electricity Outlook
Get more clean energy content on the Decarbonization Channel.
2024 U.S. Clean Electricity Outlook
This was originally posted on the Decarbonization Channel. Subscribe to the free mailing list to be the first to receive decarbonization-related visualizations with a focus on the U.S. power sector.
As the world seeks sustainable energy solutions, the U.S. has the opportunity to lead the charge in the global shift toward clean electricity.
But what kind of progress can the country expect in the upcoming year?
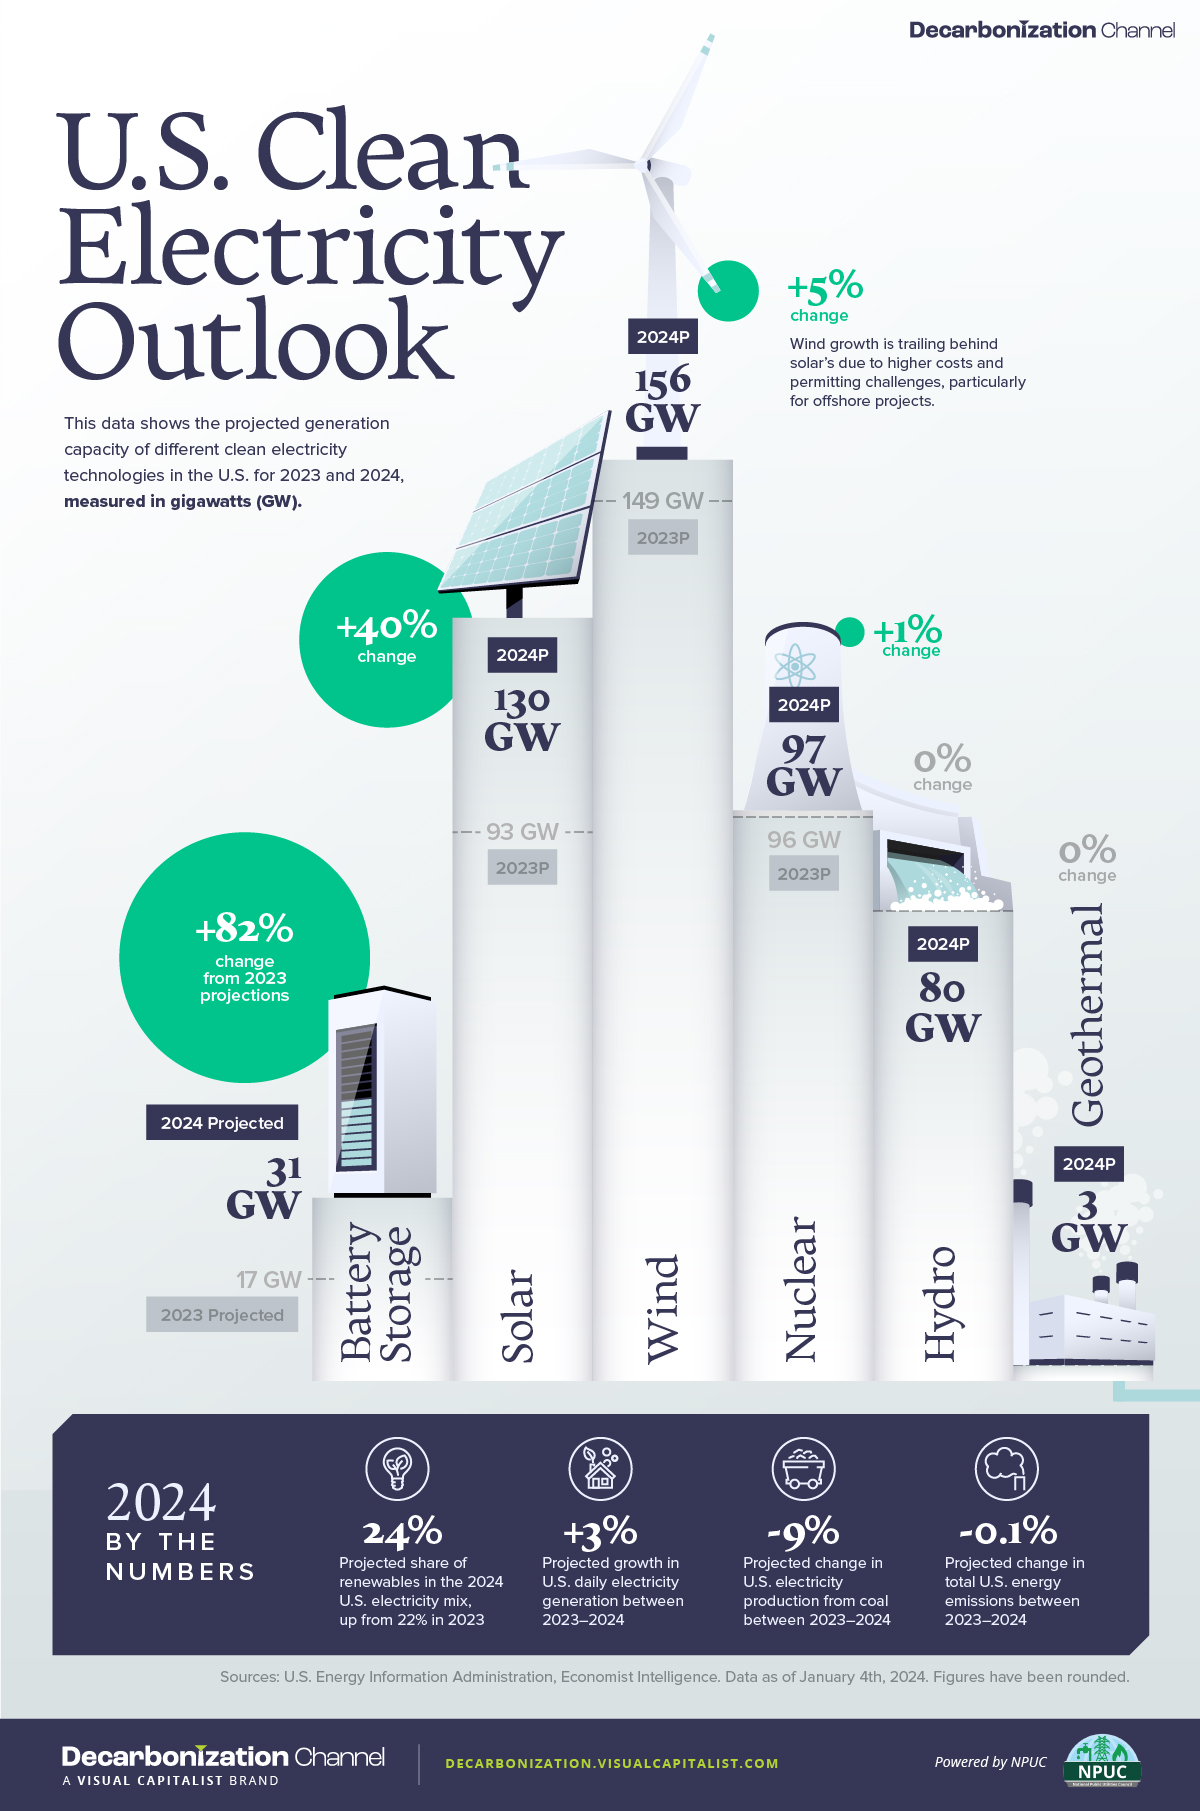
To find out, we partnered with the National Public Utilities Council to visualize the projected 2024 electricity generation capacity of clean energy technologies in the U.S., using data from the U.S. Energy Information Administration (EIA).
The Rise of Battery Storage and Solar Power
Looking ahead to 2024, U.S. generation capacity projections unveil a promising trajectory for battery storage and solar power. Battery storage is projected to grow by 82% compared to 2023 projections, while solar is projected to grow by 40%.
Growth is also expected for wind power, albeit at a slower rate (5%) due to higher costs and permitting challenges, especially for offshore projects.
| Electricity Generation Capacity Projections | 2023 | 2024 | Change |
|---|---|---|---|
| Battery Storage | 17 GW | 31 GW | +82% |
| Solar | 93 GW | 130 GW | +40% |
| Wind | 149 GW | 156 GW | +5% |
| Nuclear | 96 GW | 97 GW | +1% |
| Geothermal | 3 GW | 3 GW | 0% |
| Hydro | 80 GW | 80 GW | 0% |
As illustrated in the table above, the EIA projects a modest year for the rest of the major clean electricity sources in the nation, with nuclear expected to eke out a lackluster 1% growth, while hydro and geothermal remain unchanged.
Overall, these projections underscore a diversification of the U.S. energy portfolio, with a pronounced emphasis on renewables and energy storage. The growth in battery storage capacity, specifically, underscores efforts to overcome the intermittency challenges of renewables, ultimately ensuring a reliable and emission-free power supply in the country.
The Broader U.S. Power Sector in 2024
Beyond capacity projections, let’s also take a look at some projected trends related to the broader U.S. power sector in 2024.
- U.S. daily electricity generation is projected to grow by 3% between 2023 and 2024, reflecting an increasing demand for power in the country.
- Renewables are set to claim an even larger slice of the U.S. electricity mix in 2024, rising from 22% in 2023 to 24%.
- Electricity production from coal is projected to decline by 9% as the country continues its move away from the emission-intensive energy source.
- Despite the country’s projected growth in clean electricity capacity, total U.S. energy-related emissions are projected to drop by 0.1% in 2024.
All in all, the 2024 landscape of the U.S. power sector signifies progress with increased renewables and heightened electricity generation. However, the marginal dip in emissions emphasizes the need to ramp-up country-wide efforts to meet the goal of a net-zero future.


Who’s Building the Most Solar Energy?
This was originally posted on our Voronoi app. Download the app for free on iOS or Android and discover incredible data-driven charts from a variety of trusted sources.
In 2023, solar energy accounted for three-quarters of renewable capacity additions worldwide. Most of this growth occurred in Asia, the EU, and the U.S., continuing a trend observed over the past decade.
In this graphic, we illustrate the rise in installed solar photovoltaic (PV) capacity in China, the EU, and the U.S. between 2010 and 2022, measured in gigawatts (GW). Bruegel compiled the data..
Chinese Dominance
As of 2022, China’s total installed capacity stands at 393 GW, nearly double that of the EU’s 205 GW and surpassing the USA’s total of 113 GW by more than threefold in absolute terms.
| Installed solar capacity (GW) | China | EU27 | U.S. |
|---|---|---|---|
| 2022 | 393.0 | 205.5 | 113.0 |
| 2021 | 307.0 | 162.7 | 95.4 |
| 2020 | 254.0 | 136.9 | 76.4 |
| 2019 | 205.0 | 120.1 | 61.6 |
| 2018 | 175.3 | 104.0 | 52.0 |
| 2017 | 130.8 | 96.2 | 43.8 |
| 2016 | 77.8 | 91.5 | 35.4 |
| 2015 | 43.6 | 87.7 | 24.2 |
| 2014 | 28.4 | 83.6 | 18.1 |
| 2013 | 17.8 | 79.7 | 13.3 |
| 2012 | 6.7 | 71.1 | 8.6 |
| 2011 | 3.1 | 53.3 | 5.6 |
| 2010 | 1.0 | 30.6 | 3.4 |
Since 2017, China has shown a compound annual growth rate (CAGR) of approximately 25% in installed PV capacity, while the USA has seen a CAGR of 21%, and the EU of 16%.
Additionally, China dominates the production of solar power components, currently controlling around 80% of the world’s solar panel supply chain.
In 2022, China’s solar industry employed 2.76 million individuals, with manufacturing roles representing approximately 1.8 million and the remaining 918,000 jobs in construction, installation, and operations and maintenance.
The EU industry employed 648,000 individuals, while the U.S. reached 264,000 jobs.
According to the IEA, China accounts for almost 60% of new renewable capacity expected to become operational globally by 2028.
Despite the phasing out of national subsidies in 2020 and 2021, deployment of solar PV in China is accelerating. The country is expected to reach its national 2030 target for wind and solar PV installations in 2024, six years ahead of schedule.

-

 Demographics7 days ago
Mapped: U.S. Immigrants by Region
-

 United States2 weeks ago
Charted: What Southeast Asia Thinks About China & the U.S.
-

 United States2 weeks ago
The Evolution of U.S. Beer Logos
-

 Healthcare2 weeks ago
What Causes Preventable Child Deaths?
-

 Energy2 weeks ago
Who’s Building the Most Solar Energy?
-

 Markets1 week ago
Mapped: The Most Valuable Company in Each Southeast Asian Country
-

 Technology1 week ago
Mapped: The Number of AI Startups By Country
-

 Healthcare1 week ago
Life Expectancy by Region (1950-2050F)