Markets
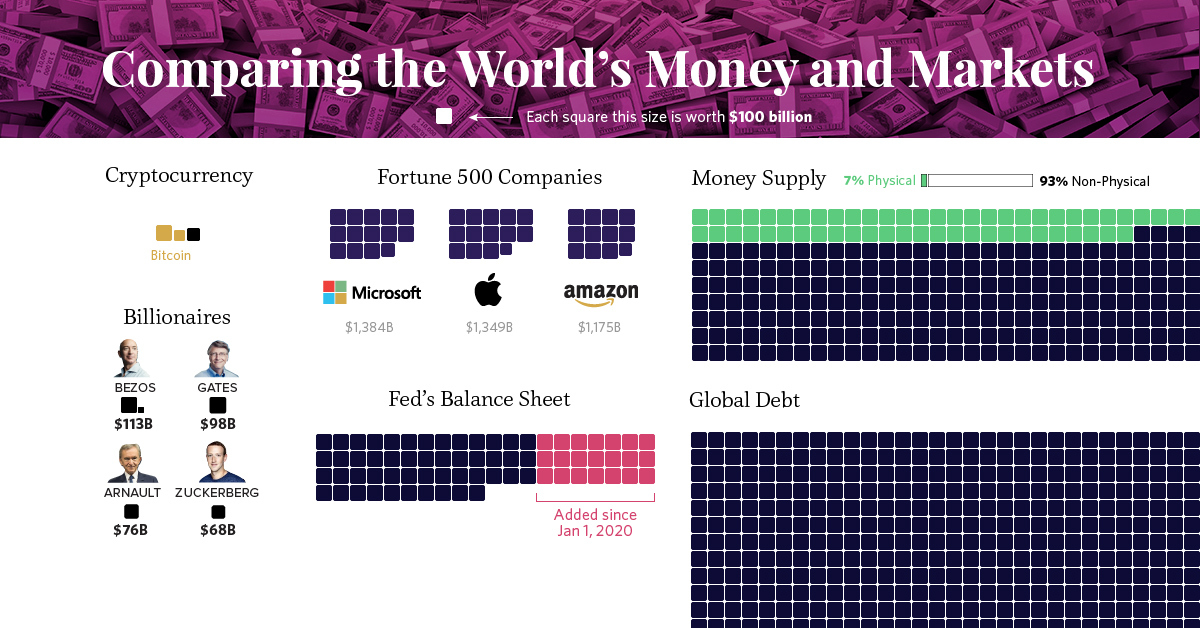
All of the World’s Money and Markets in One Visualization


All of the World’s Money and Markets in One Visualization
In the current economic circumstances, there are some pretty large numbers being thrown around by both governments and the financial media.
The U.S. budget deficit this year, for example, is projected to hit $3.8 trillion, which would be more than double the previous record set during the financial crisis ($1.41 trillion in FY2009). Meanwhile, the Fed has announced “open-ended” asset-buying programs to support the economy, which will add even more to its current $7 trillion balance sheet.
Given the scale of these new numbers—how can we relate them back to the more conventional numbers and figures that we may be more familiar with?
Introducing the $100 Billion Square
In the above data visualization, we even the playing field by using a common denominator to put the world’s money and markets all on the same scale and canvas.
Each black square on the chart is worth $100 billion, and is not a number to be trifled with:
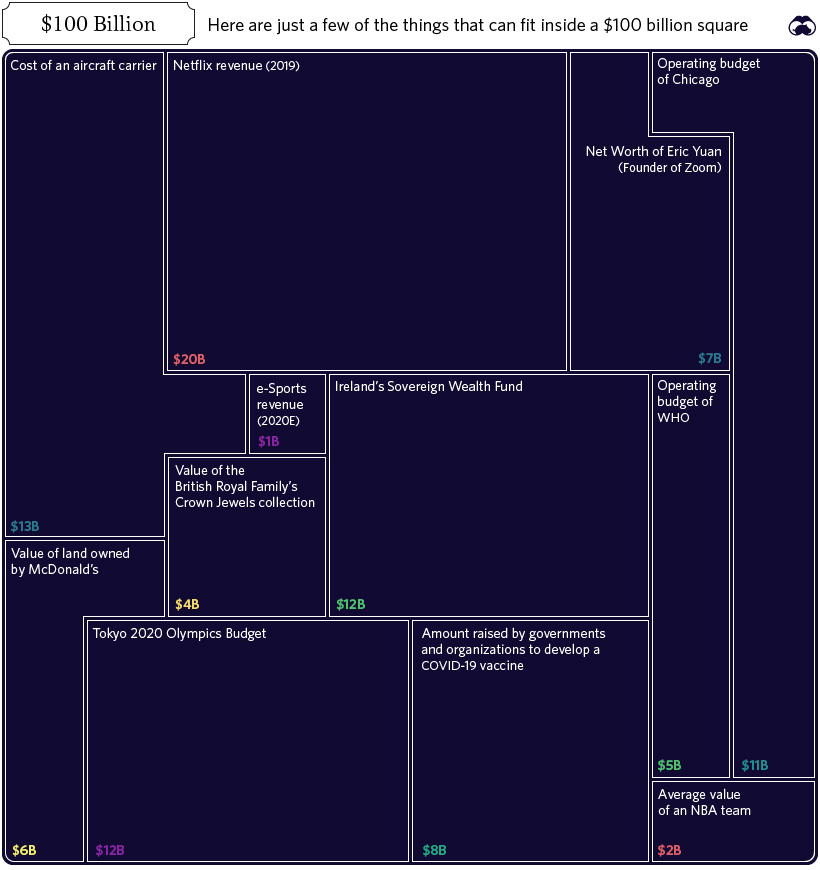
In fact, the entire annual GDP of Cuba could fit in one square ($97 billion), and the Greek economy would be roughly two squares ($203 billion).
Alternatively, if you’re contrasting this unit to numbers found within Corporate America, there are useful comparisons there as well. For example, the annual revenues of Wells Fargo ($103.9 billion) would just exceed one square, while Facebook’s would squeeze in with room to spare ($70.7 billion).
Billions, Trillions, or Quadrillions?
Here’s our full list, which sums up all of the world’s money and markets, from the smallest to the biggest, along with sources used:
| Category | Value ($ Billions, USD) | Source |
|---|---|---|
| Silver | $44 | World Silver Survey 2019 |
| Cryptocurrencies | $244 | CoinMarketCap |
| Global Military Spending | $1,782 | World Bank |
| U.S. Federal Deficit (FY 2020) | $3,800 | U.S. CBO (Projected, as of April 2020) |
| Coins & Bank Notes | $6,662 | BIS |
| Fed's Balance Sheet | $7,037 | U.S. Federal Reserve |
| The World's Billionaires | $8,000 | Forbes |
| Gold | $10,891 | World Gold Council (2020) |
| The Fortune 500 | $22,600 | Fortune 500 (2019 list) |
| Stock Markets | $89,475 | WFE (April 2020) |
| Narrow Money Supply | $35,183 | CIA Factbook |
| Broad Money Supply | $95,698 | CIA Factbook |
| Global Debt | $252,600 | IIF Debt Monitor |
| Global Real Estate | $280,600 | Savills Global Research (2018 est.) |
| Global Wealth | $360,603 | Credit Suisse |
| Derivatives (Market Value) | $11,600 | BIS (Dec 2019) |
| Derivatives (Notional Value) | $558,500 | BIS (Dec 2019) |
| Derivatives (Notional Value - High end) | $1,000,000 | Various sources (Unofficial) |
Derivatives top the list, estimated at $1 quadrillion or more in notional value according to a variety of unofficial sources.
However, it’s worth mentioning that because of their non-tangible nature, the value of financial derivatives are measured in two very different ways. Notional value represents the position or obligation of the contract (i.e. a call to buy 100 shares at the price of $50 per share), while gross market value measures the price of the derivative security itself (i.e. $1.00 per call option, multiplied by 100 shares).
It’s a subtle difference that manifests itself in a big way numerically.
Correction: Graphic updated to reflect the average value of an NBA team.


Maps
Mapped: The 10 U.S. States With the Lowest Real GDP Growth
In this graphic, we show where real GDP lagged the most across America in 2023 as high interest rates weighed on state economies.


The Top 10 U.S. States, by Lowest Real GDP Growth
This was originally posted on our Voronoi app. Download the app for free on iOS or Android and discover incredible data-driven charts from a variety of trusted sources.
While the U.S. economy defied expectations in 2023, posting 2.5% in real GDP growth, several states lagged behind.
Last year, oil-producing states led the pack in terms of real GDP growth across America, while the lowest growth was seen in states that were more sensitive to the impact of high interest rates, particularly due to slowdowns in the manufacturing and finance sectors.
This graphic shows the 10 states with the least robust real GDP growth in 2023, based on data from the Bureau of Economic Analysis.
Weakest State Economies in 2023
Below, we show the states with the slowest economic activity in inflation-adjusted terms, using chained 2017 dollars:
| Rank | State | Real GDP Growth 2023 YoY | Real GDP 2023 |
|---|---|---|---|
| 1 | Delaware | -1.2% | $74B |
| 2 | Wisconsin | +0.2% | $337B |
| 3 | New York | +0.7% | $1.8T |
| 4 | Missississippi | +0.7% | $115B |
| 5 | Georgia | +0.8% | $661B |
| 6 | Minnesota | +1.2% | $384B |
| 7 | New Hampshire | +1.2% | $91B |
| 8 | Ohio | +1.2% | $698B |
| 9 | Iowa | +1.3% | $200B |
| 10 | Illinois | +1.3% | $876B |
| U.S. | +2.5% | $22.4T |
Delaware witnessed the slowest growth in the country, with real GDP growth of -1.2% over the year as a sluggish finance and insurance sector dampened the state’s economy.
Like Delaware, the Midwestern state of Wisconsin also experienced declines across the finance and insurance sector, in addition to steep drops in the agriculture and manufacturing industries.
America’s third-biggest economy, New York, grew just 0.7% in 2023, falling far below the U.S. average. High interest rates took a toll on key sectors, with notable slowdowns in the construction and manufacturing sectors. In addition, falling home prices and a weaker job market contributed to slower economic growth.
Meanwhile, Georgia experienced the fifth-lowest real GDP growth rate. In March 2024, Rivian paused plans to build a $5 billion EV factory in Georgia, which was set to be one of the biggest economic development initiatives in the state in history.
These delays are likely to exacerbate setbacks for the state, however, both Kia and Hyundai have made significant investments in the EV industry, which could help boost Georgia’s manufacturing sector looking ahead.

-

 Personal Finance1 week ago
Visualizing the Tax Burden of Every U.S. State
-

 Misc6 days ago
Visualized: Aircraft Carriers by Country
-

 Culture6 days ago
How Popular Snack Brand Logos Have Changed
-

 Mining1 week ago
Visualizing Copper Production by Country in 2023
-

 Misc1 week ago
Charted: How Americans Feel About Federal Government Agencies
-

 Healthcare1 week ago
Which Countries Have the Highest Infant Mortality Rates?
-

 Demographics1 week ago
Mapped: U.S. Immigrants by Region
-

 Maps1 week ago
Mapped: Southeast Asia’s GDP Per Capita, by Country