Business
Flying High: The Top Ten Airline Routes by Revenue
Flying High: The Top 10 Airline Routes by Revenue
The airline industry is a tough business. Profit margins are narrow, airplanes are expensive to run and maintain, and government regulation and taxation can be onerous and unpredictable.
In addition, demand can stall by the outbreak of disease, recession, war, or terrorism. So when a company has a winning airline route, it makes all the difference to a company’s bottom line.
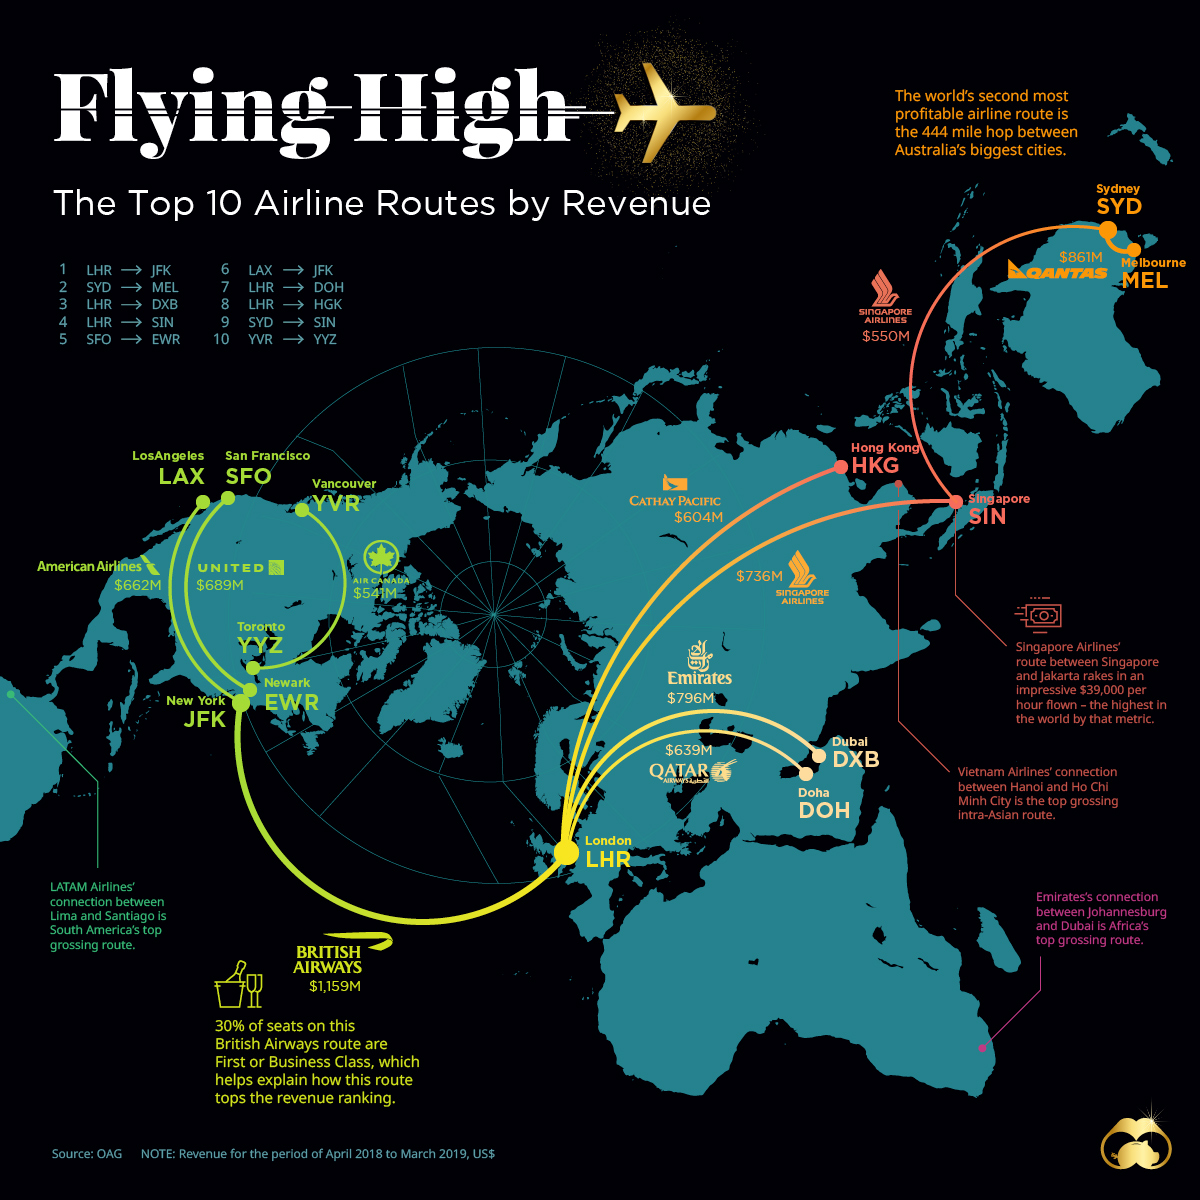
Today’s visualization uses data from OAG Aviation Worldwide, which tracked the airline routes that generated the most revenue from April 2018 to March 2019.
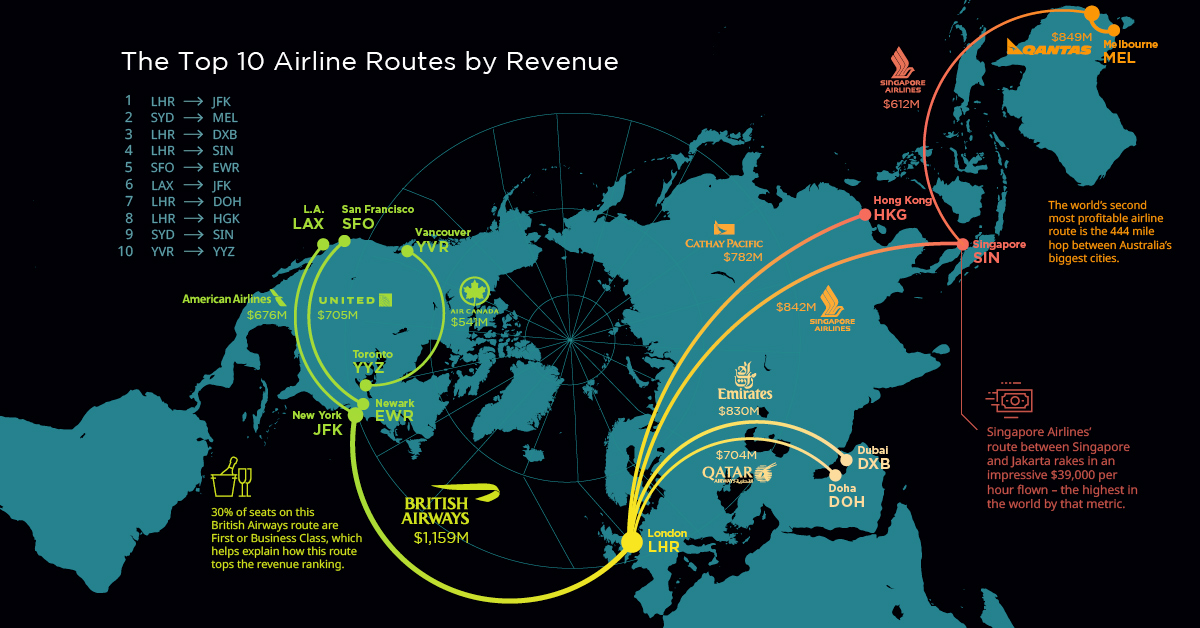
Top 10 Highest Revenue Routes by Airline
North American routes dominate the global rankings. However, it is the connections from the U.S Northeast and Europe that generate the most revenue and often the most delays.
Only one route breaks the billion dollar barrier: British Airways’ service between London Heathrow Airport (LHR) and New York’s John F. Kennedy Airport (JFK).
| Airline | Airport Pair | Countries | Total Revenue US$ 2018/19 |
|---|---|---|---|
| British Airways | JFK-LHR | 🇺🇸🇬🇧 | $1,159,126,794 |
| Qantas Airlines | MEL-SYD | 🇦🇺 | $849,260,322 |
| Emirates | LHR-DXB | 🇬🇧🇦🇪 | $796,201,645 |
| Singapore Airlines | LHR-SIN | 🇬🇧🇸🇬 | $735,597,614 |
| United Airlines | SFO-EWR | 🇺🇸 | $689,371,368 |
| American Airlines | LAX-JFK | 🇺🇸 | $661,739,368 |
| Qatar Airways | LHR-DOH | 🇬🇧🇶🇦 | $639,122,609 |
| Cathay Pacific Airways | HKG-LHR | 🇭🇰🇬🇧 | $604,595,063 |
| Singapore Airlines | SYD-SIN | 🇦🇺🇸🇬 | $549,711,946 |
| Air Canada | YVR-YYZ | 🇨🇦 | $541,122,509 |
Air Canada’s route between Vancouver and Toronto bottoms out the list with $541 million of revenue in 2019. Low population density, high infrastructure costs, and an aviation industry that is essentially an oligopoly, are all factors driving up ticket costs in Canada.
North America, Top 10 Highest Revenue Routes by Airline
Here’s a look at only the top-grossing routes connected to North America, including the prior ones that made the global list.
| Airline | Airport Pair | Countries | Total Revenue US$ 2018/19 |
|---|---|---|---|
| British Airways | JFK-LHR | 🇺🇸🇬🇧 | $1,159,126,794 |
| United Airlines | SFO-EWR | 🇺🇸 | $689,371,368 |
| American Airlines | LAX-JFK | 🇺🇸 | $661,739,788 |
| Air Canada | YVR-YYZ | 🇨🇦 | $541,122,509 |
| British Airways | BOS-LHR | 🇺🇸🇬🇧 | $523,527,241 |
| Air France | JFK-CDG | 🇺🇸🇫🇷 | $486,378,698 |
| United Airlines | LAX-EWR | 🇺🇸 | $479,908,312 |
| Cathay Pacific Airways | JFK-HKG | 🇺🇸🇭🇰 | $475,514,451 |
| Delta Air Lines | LAX-JFK | 🇺🇸 | $465,130,366 |
| British Airways | LAX-LHR | 🇺🇸🇬🇧 | $452,136,502 |
Transcontinental routes dominate the domestic market with LAX–JFK appearing twice in the ranking for both American and Delta Air Lines.
Asia, Top 10 Highest Revenue Routes by Airline
Despite Asia’s rise as an economic superpower, there are no routes that break the billion dollar barrier. Singapore Airlines’ Singapore (SIN) to London’s Heathrow (LHR) tops the list, generating $736 million in 2019.
| Airline | Airport Pair | Countries | Total Revenue US$ 2018/19 |
|---|---|---|---|
| Singapore Airlines | SIN-LHR | 🇸🇬🇬🇧 | $735,597,614 |
| Cathay Pacific Airlines | HKG-LHR | 🇭🇰🇬🇧 | $604,595,063 |
| Singapore Airlines | SIN-SYD | 🇸🇬🇦🇺 | $549,711,946 |
| Vietnam Airlines | SGN-HAN | 🇻🇳 | $488,487,259 |
| Cathay Pacific Airlines | HKG-JFK | 🇭🇰🇺🇸 | $475,514,451 |
| Japan Airlines | OKA-HND | 🇯🇵 | $447,224,346 |
| Singapore Airlines | CGK-SIN | 🇮🇩🇸🇬 | $436,905,694 |
| Japan Airlines | FUK-HND | 🇯🇵 | $431,457,469 |
| Singapore Airlines | SIN-MEL | 🇸🇬🇦🇺 | $414,276,407 |
| Cathay Pacific Airlines | HKG-SIN | 🇭🇰🇸🇬 | $389,910,239 |
The routes that dominate Asia connect the financial hubs of London, New York, Singapore, and Hong Kong. There are also two domestic routes in Japan, connecting both Fukuoka (FUK) and Okinawa (OKA) to Tokyo’s Haneda (HND) airport.
Africa, Top 10 Highest Revenue Routes by Airline
At the top of the ranking in Africa is Johannesburg (JNB) to Dubai International Airport (DXB) with revenues of $315 million. Dubai has become an important hub for high value flights arriving and departing Africa, a position that may prove profitable as air traffic on the continent increases in coming years.
| Airline | Airport Pair | Countries | Total Revenue US$ 2018/19 |
|---|---|---|---|
| Emirates | JNB-DXB | 🇿🇦🇦🇪 | $315,678,326 |
| British Airways | JNB-LHR | 🇿🇦🇬🇧 | $295,167,492 |
| Saudi Arabian Airlines | CAI-JED | 🇪🇬🇸🇦 | $242,155,949 |
| TAAG Angola Airlines | LAD-LIS | 🇦🇴🇵🇹 | $231,155,949 |
| South African Airlines | JNB-CPT | 🇿🇦 | $184,944,128 |
| Emirates | CAI-DXB | 🇪🇬🇦🇪 | $181,392,011 |
| Emirates | CPT-DXB | 🇿🇦🇦🇪 | $176,743,498 |
| Air France | ABJ-CDG | 🇨🇮🇫🇷 | $174,986,272 |
| British Airways | CPT-LHR | 🇿🇦🇬🇧 | $174,605,201 |
| Emirates | MRU-DXB | 🇲🇺🇦🇪 | $163,952,609 |
Despite the smaller earnings compared to larger markets, some airline companies see the potential for growth in Africa. Virgin Atlantic will fly a route between London’s Heathrow and Cape Town in South Africa, while Qatar Airlines acquired a stake in RwandAir.
Financial Hubs
The cities that appear in the top revenue ranking are revealing. Since business and first class travelers are such an important revenue driver, it makes sense that connections between the world’s financial hubs are delivering big value to airlines.
As Asian and African economies continue to evolve, what route could be the next billion dollar route for airlines?


Finance
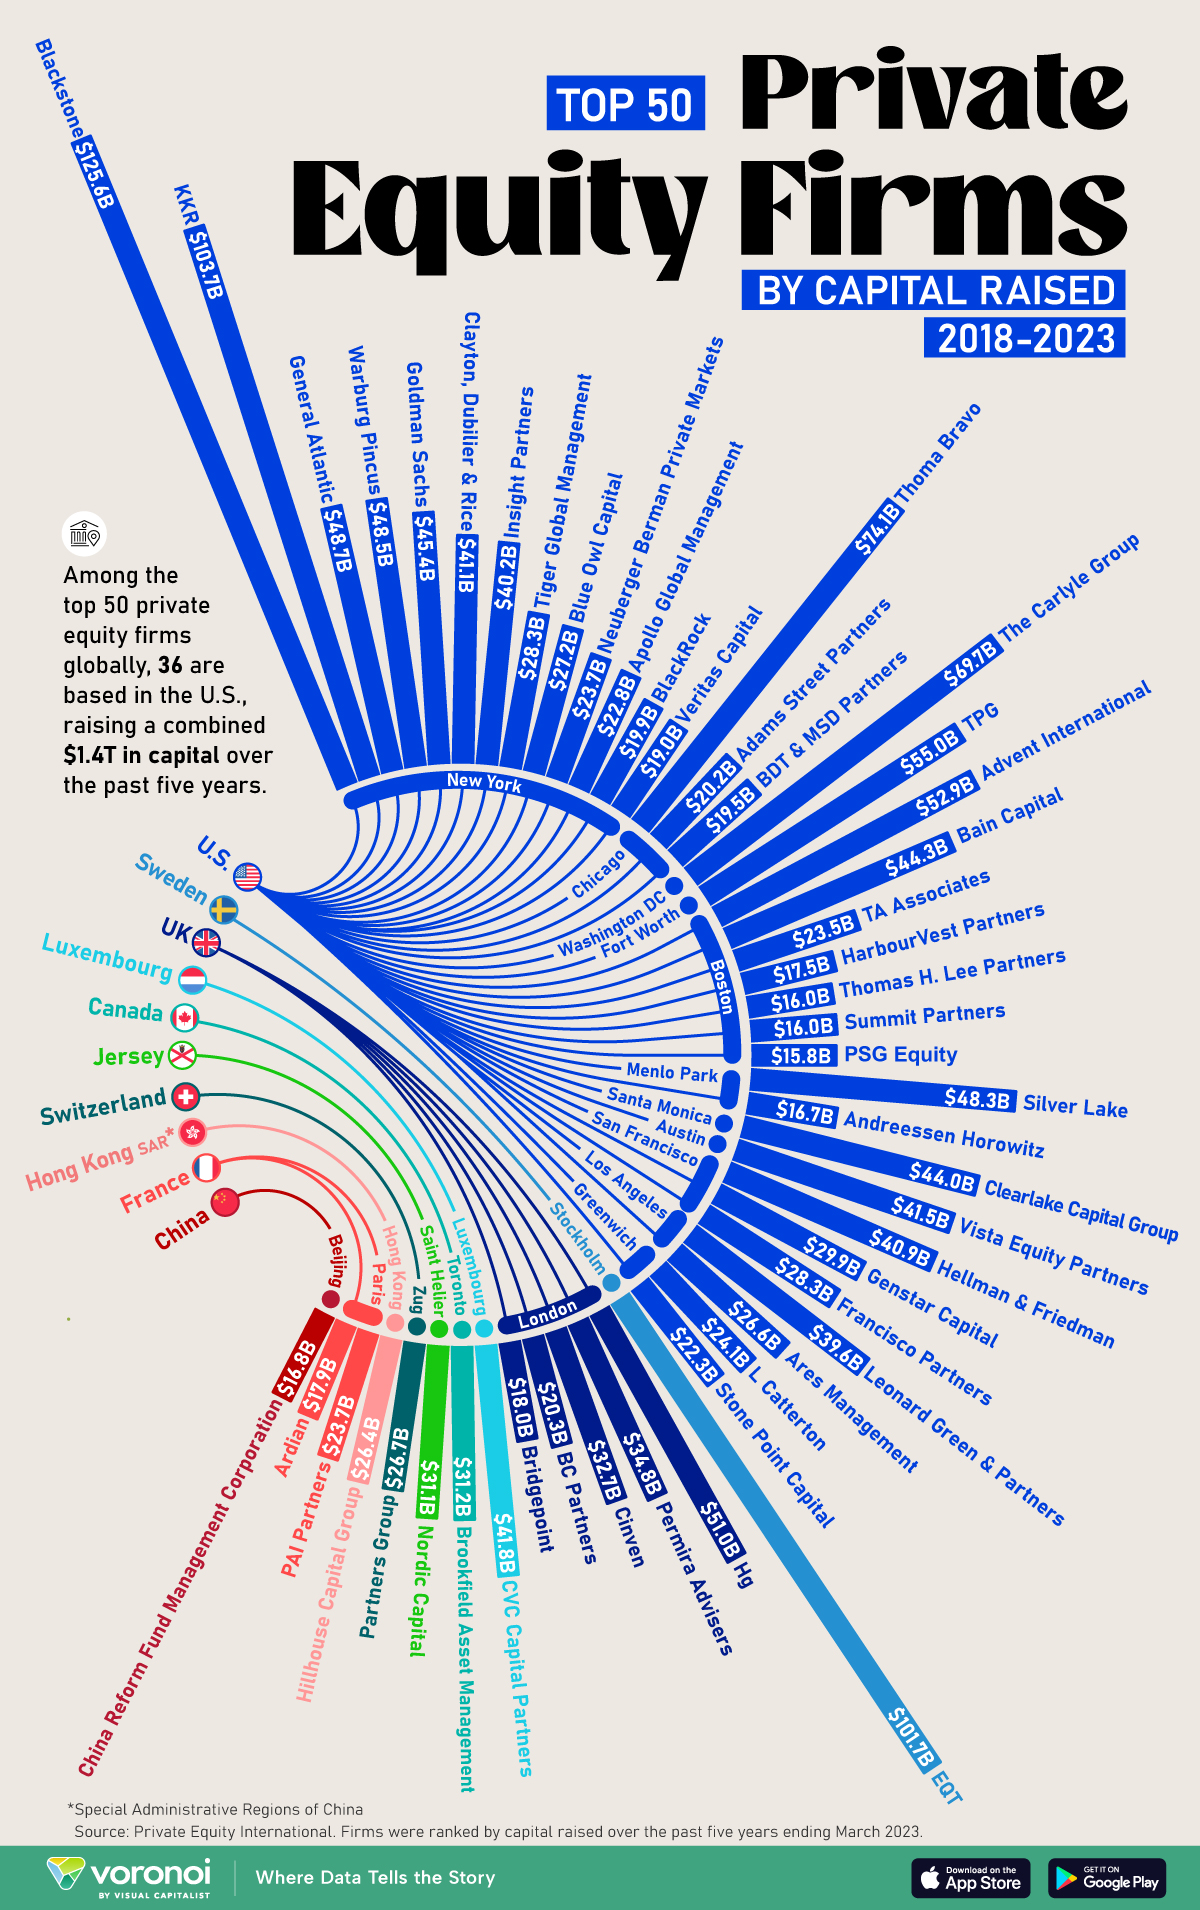
Ranked: The World’s 50 Largest Private Equity Firms
In this graphic, we show the largest private equity firms in the world—from titan Blackstone to China’s leading alternative funds.
The World’s 50 Largest Private Equity Firms
This was originally posted on our Voronoi app. Download the app for free on iOS or Android and discover incredible data-driven charts from a variety of trusted sources.
In 2023, private equity firms controlled $8.2 trillion in assets globally according to McKinsey & Company, a figure that has rapidly expanded since the industry first emerged 40 years ago.
As large investors such as pension funds and insurance companies increasingly look to private markets, these alternative asset managers have seen their assets grow by more than twofold in the last five years.
This graphic shows the top 50 private equity firms worldwide, based on data from Private Equity International (PEI).
The Top 50 Private Equity Firms
To determine the rankings, private equity firms were defined as those that raise capital with the purpose of directly investing in businesses, covering diversified private equity, venture capital, growth equity, buyouts, along with turnaround or control-oriented distressed investment capital.
The ranking does not include funds of funds, private investment in public equity (PIPE), or funds that follow a secondaries, real estate, infrastructure, hedge fund, debt or mezzanine strategies.
Below, we show the 50 biggest private equity companies around the world, measured by the scale of capital raised over the five-year period ending March 31, 2023:
| Ranking | Fund Manager | City | Capital Raised |
|---|---|---|---|
| 1 | Blackstone | New York | $125.6B |
| 2 | KKR | New York | $103.7B |
| 3 | EQT | Stockholm | $101.7B |
| 4 | Thoma Bravo | Chicago | $74.1B |
| 5 | The Carlyle Group | Washington DC | $69.7B |
| 6 | TPG | Fort Worth | $55.0B |
| 7 | Advent International | Boston | $52.9B |
| 8 | Hg | London | $51.0B |
| 9 | General Atlantic | New York | $48.7B |
| 10 | Warburg Pincus | New York | $48.5B |
| 11 | Silver Lake | Menlo Park | $48.3B |
| 12 | Goldman Sachs | New York | $45.4B |
| 13 | Bain Capital | Boston | $44.3B |
| 14 | Clearlake Capital Group | Santa Monica | $44.0B |
| 15 | CVC Capital Partners | Luxembourg | $41.8B |
| 16 | Vista Equity Partners | Austin | $41.5B |
| 17 | Clayton, Dubilier & Rice | New York | $41.1B |
| 18 | Hellman & Friedman | San Francisco | $40.9B |
| 19 | Insight Partners | New York | $40.2B |
| 20 | Leonard Green & Partners | Los Angeles | $39.6B |
| 21 | Permira Advisers | London | $34.8B |
| 22 | Cinven | London | $32.7B |
| 23 | Brookfield Asset Management | Toronto | $31.2B |
| 24 | Nordic Capital | Saint Helier | $31.1B |
| 25 | Genstar Capital | San Francisco | $29.9B |
| 26 | Francisco Partners | San Francisco | $28.3B |
| 27 | Tiger Global Management | New York | $28.3B |
| 28 | Blue Owl Capital | New York | $27.2B |
| 29 | Partners Group | Zug | $26.7B |
| 30 | Ares Management | Los Angeles | $26.6B |
| 31 | Hillhouse Capital Group | Singapore | $26.4B |
| 32 | L Catterton | Greenwich | $24.1B |
| 33 | Neuberger Berman Private Markets | New York | $23.7B |
| 34 | PAI Partners | Paris | $23.7B |
| 35 | TA Associates | Boston | $23.5B |
| 36 | Apollo Global Management | New York | $22.8B |
| 37 | Stone Point Capital | Greenwich | $22.3B |
| 38 | BC Partners | London | $20.3B |
| 39 | Adams Street Partners | Chicago | $20.2B |
| 40 | BlackRock | New York | $19.9B |
| 41 | BDT & MSD Partners | Chicago | $19.5B |
| 42 | Veritas Capital | New York | $19.0B |
| 43 | Bridgepoint | London | $18.0B |
| 44 | Ardian | Paris | $17.9B |
| 45 | HarbourVest Partners | Boston | $17.5B |
| 46 | China Reform Fund Management Corporation | Beijing | $16.8B |
| 47 | Andreessen Horowitz | Menlo Park | $16.7B |
| 48 | Thomas H. Lee Partners | Boston | $16.0B |
| 49 | Summit Partners | Boston | $16.0B |
| 50 | PSG Equity | Boston | $15.8B |
Private equity titan Blackstone is the top in the United States and the world, raising $125.6 billion in capital from 2018 to 2023.
Headquartered in New York, Blackstone’s total assets under management stood at $991 billion as of the first quarter of 2023, and have since surpassed $1 trillion this year. For perspective, this is comparable to the GDP of the Netherlands.
Following next in line are KKR and Sweden’s EQT, each raising over $100 billion. In fact, this was the first time three firms achieved this $100 billion equity-raise milestone in PEI’s ranking over a five-year period. This was particularly notable given a challenging fundraising landscape amid higher borrowing costs and lagging dealmaking activity.
North American Firms Dominate Private Equity
As we can see, the vast majority of the biggest private equity firms are based in America, accounting for 36 of the top 50 firms globally. North American PE firms made up $1.34 trillion (72%) of the $1.85 trillion raised by the top 50 firms in the ranking.
Falling in second by a wide margin is Europe, with nine firms making up $179 billion (9.7%) of the total funds raised. Many of Europe’s largest private equity firms are based in London, England, with the most prominent asset managers in the city being Hg and Permira Advisors.
Across Asia, the top alternative investment firm was Singapore-based Hillhouse Capital Group, which launched in 2005. The firm has backed several internet companies spanning from Tencent, the largest publicly-traded company in China, to Baidu, but has faced increasing setbacks amid regulatory crackdowns and a sluggish Chinese stock market.

-

 Personal Finance1 week ago
Visualizing the Tax Burden of Every U.S. State
-

 Misc6 days ago
Visualized: Aircraft Carriers by Country
-

 Culture7 days ago
How Popular Snack Brand Logos Have Changed
-

 Mining1 week ago
Visualizing Copper Production by Country in 2023
-

 Misc1 week ago
Charted: How Americans Feel About Federal Government Agencies
-

 Healthcare1 week ago
Which Countries Have the Highest Infant Mortality Rates?
-

 Demographics1 week ago
Mapped: U.S. Immigrants by Region
-

 Maps1 week ago
Mapped: Southeast Asia’s GDP Per Capita, by Country