Business
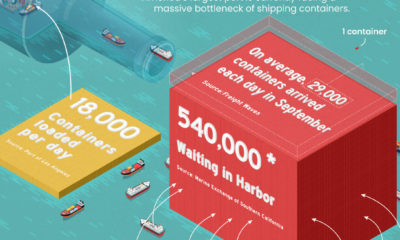
Panama Canal Expansion Facts
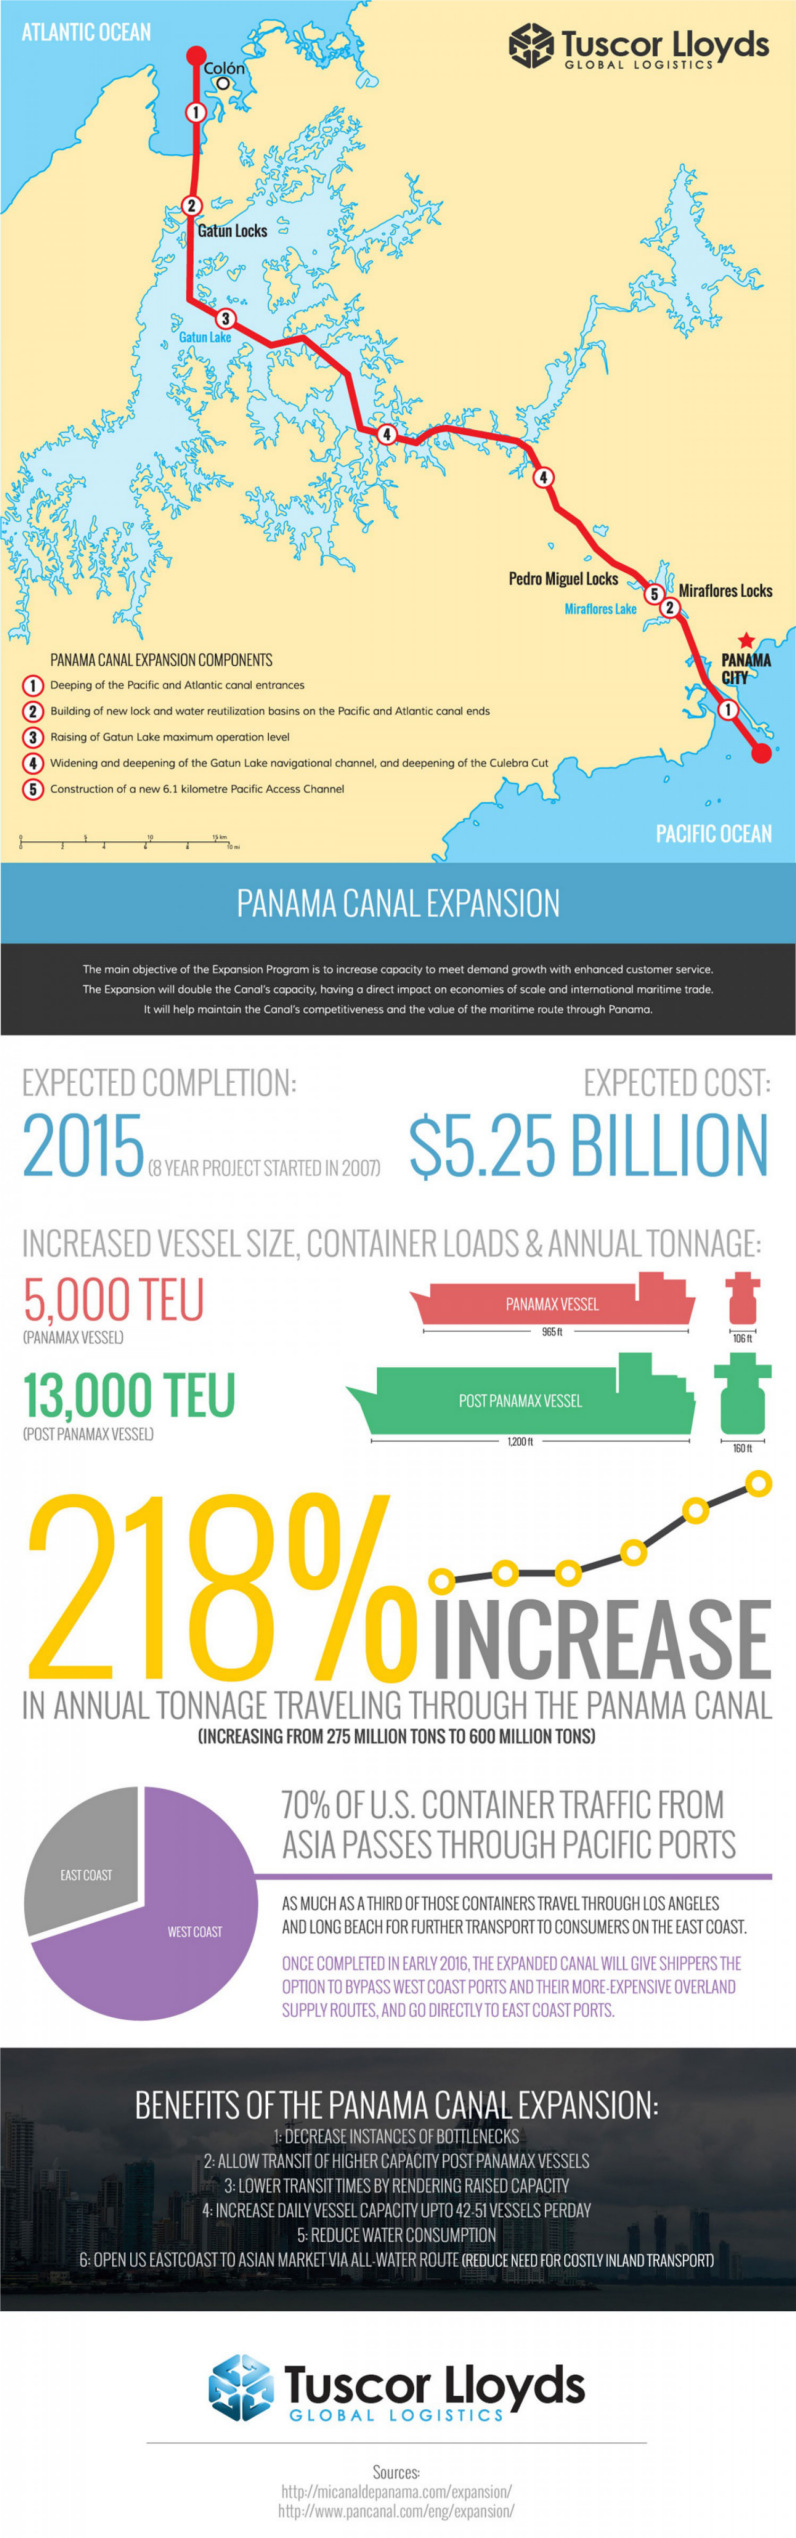
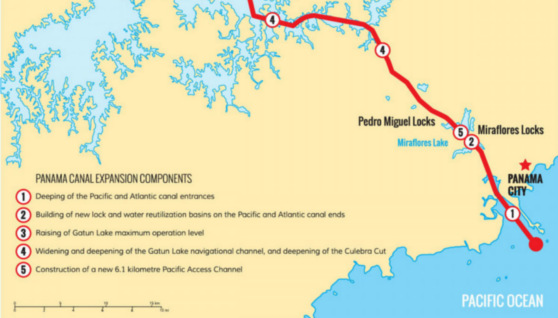
Panama Canal Expansion Facts
The Panama Canal expansion began in 2007, and will be finally completed next year. The project, costing $5.25 billion, will have a large effect on international trade.
The most important result will be the amount of tonnage travelling through the canal. Yearly tonnage is expected to increase 218% from 275 million tons to 600 million tons.
An important boon of the expansion will be to LNG exporting countries, as most LNG carriers will be able to fit through the new canal. As an example, a Bloomberg report has the cost for an LNG ship from Sabine Pass, Louisiana to make it to Fukuoka, Japan pre-expansion at $11.4 million, taking 63.6 days. With the new Panamax expansion, it would cost $8 million and take only 43.4 days for a carrier to make the voyage.
Original graphic: Tuscor Lloyds


Business
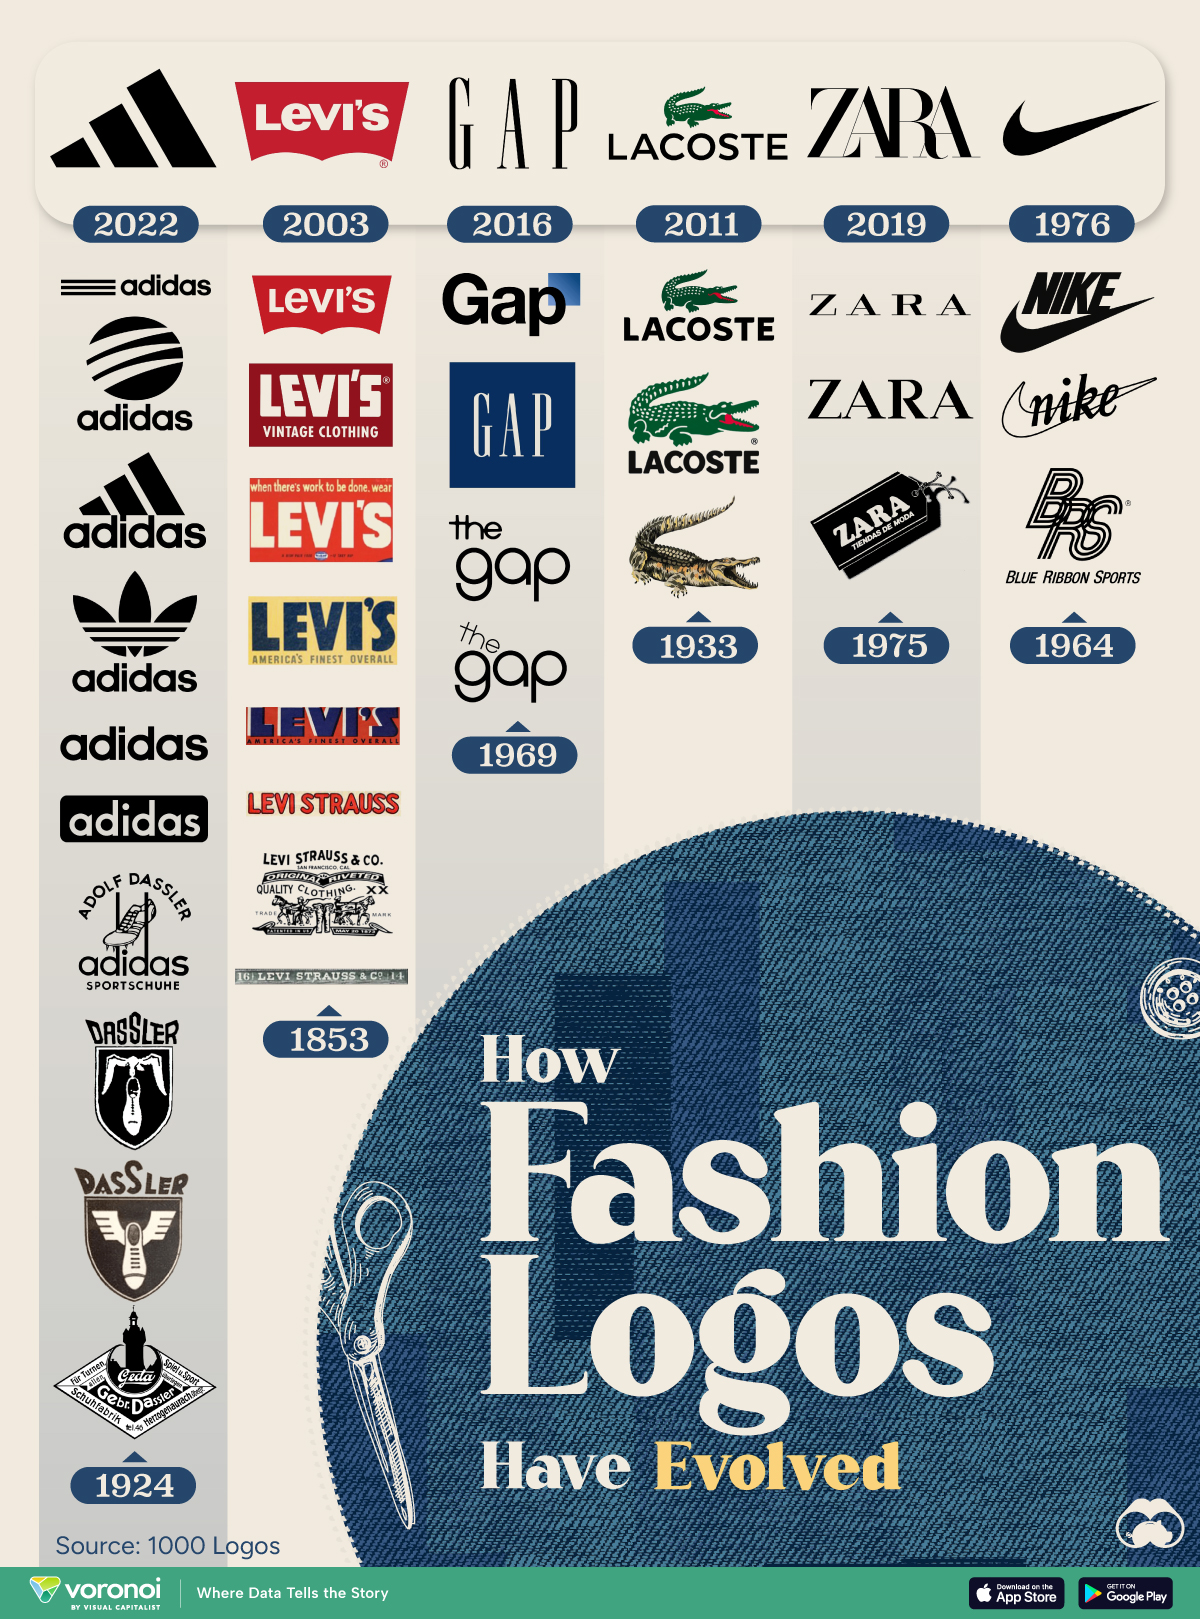
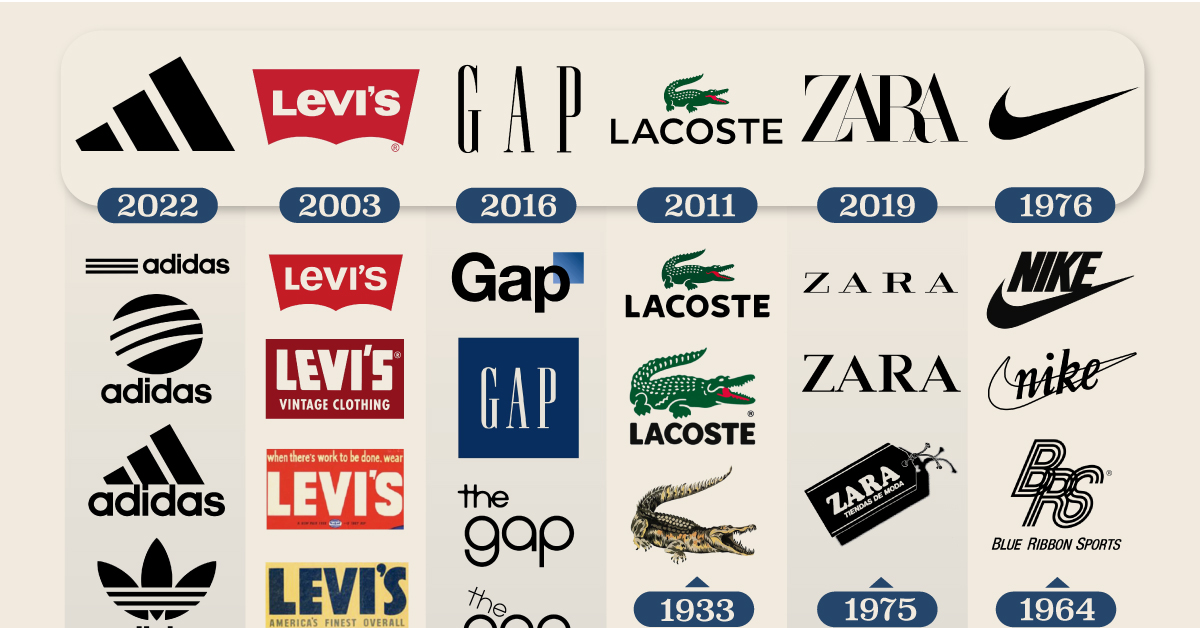
Charted: How the Logos of Select Fashion Brands Have Evolved
For some fashion brands, changing logos mirror the constant loop of reinvention, over decades of building products, markets, and consumer bases.
Charted: How the Logos of Select Fashion Brands Have Evolved
This was originally posted on our Voronoi app. Download the app for free on iOS or Android and discover incredible data-driven charts from a variety of trusted sources.
A global fashion brand needs to balance maintaining a consistent style built painstakingly over the years while adapting to current trends. And for some of them, their changing logos reflect the loop of reinvention, over decades of building products, markets, and consumer bases.
We illustrate the evolution of six fashion companies’ logos over time. Data for the visualization and article is sourced from 1000logos.net.
Nike & Adidas: A Tale of Two Shoe Companies
The world’s largest footwear company, Nike began its journey as Blue Ribbon Sports in 1964. In 1971, they rebranded as Nike, inspired by the Greek goddess of victory.
The famous swoosh logo was designed in 1971 by Carolyn Davidson, at the time a Portland State University graphic design student. She was paid $35 dollars for her work (about $270 today). Twelve years later, Nike co-founder Phil Knight have her 500 Nike shares that have remained unsold.
Here’s how often some of the world’s biggest fashion brands have changed their logos since founding.
| Brand | Logo Changes |
|---|---|
| 👟 Adidas | 10 |
| 👖 Levi's | 8 |
| ✔️ Nike | 4 |
| 👕 Gap | 4 |
| 🐊 Lacoste | 3 |
| 👗 Zara | 3 |
Meanwhile, Adidas has far older origins: all the way back to 1920 Germany. Founded by Adolf Dassler, the company split into Adidas and Puma in 1947.
Dassler bought the iconic three stripes from another German sports company in 1947. In 1952, the stripes debuted on Adidas footwear at the Summer Olympics.
Currently, Adidas has several concurrent logos depending on the product line. This includes: the horizontal across a trefoil (Adidas Originals), curved across a circle (Adidas Style) or the diagonal mountain above the brand name (Adidas Performance).

-

 Markets1 week ago
Mapped: The Most Valuable Company in Each Southeast Asian Country
-

 Personal Finance7 days ago
Visualizing the Tax Burden of Every U.S. State
-

 Mining7 days ago
Where the World’s Aluminum is Smelted, by Country
-

 Technology1 week ago
Countries With the Highest Rates of Crypto Ownership
-

 Money1 week ago
Charted: What Frustrates Americans About the Tax System
-

 Economy1 week ago
Mapped: Europe’s GDP Per Capita, by Country
-

 Stocks1 week ago
The Growth of a $1,000 Equity Investment, by Stock Market
-

 Healthcare1 week ago
Life Expectancy by Region (1950-2050F)