Demographics
Visualizing the World’s Plummeting Fertility Rate


Visualizing the World’s Plummeting Fertility Rate
At the dawn of the 19th century, the world population hit a big milestone: 1 billion people.
Over the next 220 years, the number grew to eight times that, or the 8 billion people who live on the planet today, with half of the growth occurring since 1975.
This continuous climb in global population has been possible thanks to advancements in healthcare and nutrition. However, the UN forecasts that rapid growth will slow down—and may even stop entirely by 2100—because of falling fertility rates.
What does that mean for modern nation states conditioned to expect a constant influx of new citizens and labor to power their economies? And how can those changing economies adapt to a shrinking population?
To understand that, we need to first untangle fertility rates, and why they’re falling.
Explained: Fertility and Replacement Rates
The total fertility rate is the average number of births per woman over a lifetime. This measurement makes two key assumptions, however:
- The woman will live to the end of her childbearing years
- The woman will bear children according to the age-specific fertility rates currently observed
Both assumptions add some uncertainty to future fertility rate projections. However, decades of past data collected by the World Bank help show some overall trends around the world, and in many countries.
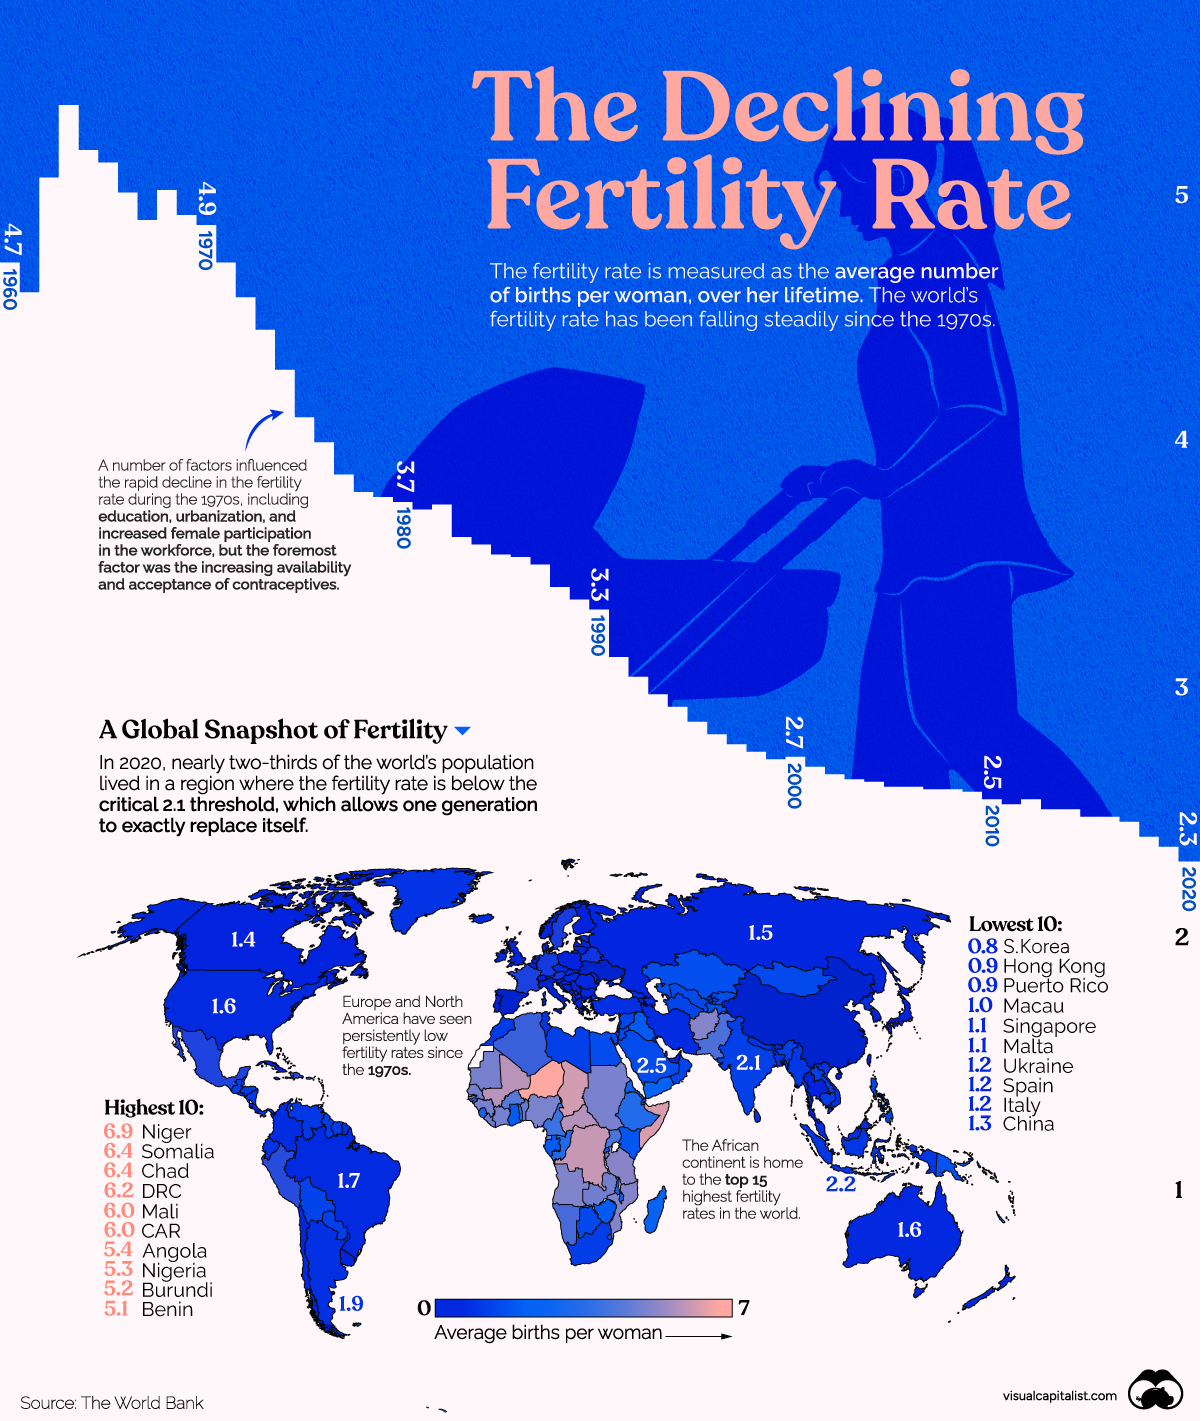
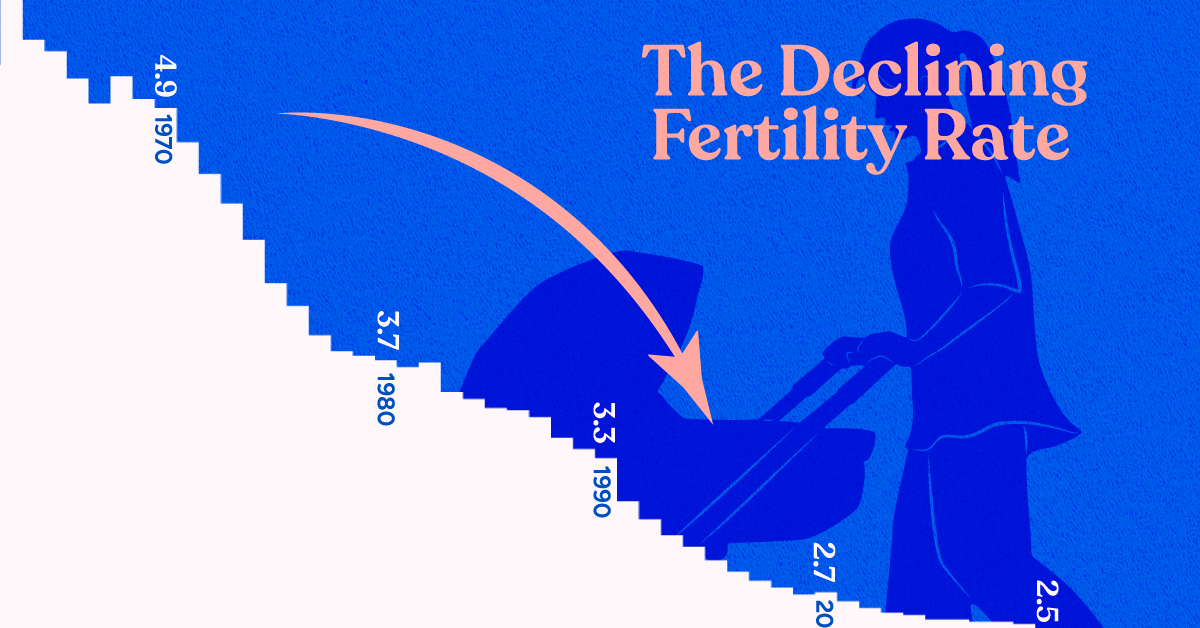
The world fertility rate (expressed as the number of children per woman) has been falling steadily since the 1970s.
In 2020, the world’s fertility rate stood at 2.3, slightly above the replacement rate of 2.1 births per woman, which allows for one generation to replace itself. This is down more than two times from 4.7 in 1960.
But the world’s average hides the vast disparities between the fertility rate of countries. We dive into the differences below.
Which Country has the Highest Fertility Rate?
According to the UN, nearly two-thirds of the world’s population lives in a region where the fertility rate is below the critical 2.1 threshold. In the table below, countries are ranked from the highest to lowest average births per woman in 2020.
| Rank | Country Name | 1960 | 1975 | 1990 | 2005 | 2020 |
|---|---|---|---|---|---|---|
| 1 | Niger | 7.53 | 7.54 | 7.81 | 7.62 | 6.89 |
| 2 | Somalia | 7.25 | 7.03 | 7.44 | 7.48 | 6.42 |
| 3 | Chad | 6.25 | 6.88 | 7.22 | 7.13 | 6.35 |
| 4 | Dem. Rep. of Congo | 6.08 | 6.42 | 6.70 | 6.60 | 6.21 |
| 5 | Mali | 7.00 | 7.24 | 7.25 | 6.72 | 6.04 |
| 6 | Central African Republic | 5.81 | 5.89 | 6.05 | 5.85 | 5.99 |
| 7 | Angola | 6.71 | 7.49 | 7.27 | 6.46 | 5.37 |
| 8 | Nigeria | 6.36 | 6.77 | 6.46 | 6.07 | 5.31 |
| 9 | Burundi | 7.00 | 7.24 | 7.37 | 6.71 | 5.18 |
| 10 | Benin | 6.28 | 6.85 | 6.73 | 5.68 | 5.05 |
| 11 | Burkina Faso | 6.25 | 6.91 | 7.01 | 6.18 | 4.87 |
| 12 | Tanzania | 6.73 | 7.00 | 6.20 | 5.61 | 4.80 |
| 13 | Gambia | 6.25 | 6.41 | 6.22 | 5.72 | 4.78 |
| 14 | Afghanistan | 7.28 | 7.54 | 7.57 | 6.91 | 4.75 |
| 15 | Mozambique | 6.32 | 6.69 | 6.22 | 5.61 | 4.71 |
| 16 | Uganda | 6.94 | 7.23 | 7.04 | 6.57 | 4.69 |
| 17 | Cameroon | 5.65 | 6.39 | 6.39 | 5.41 | 4.54 |
| 18 | South Sudan | 6.72 | 6.92 | 7.99 | 6.17 | 4.54 |
| 19 | Sudan | 6.65 | 6.93 | 6.17 | 5.04 | 4.54 |
| 20 | Guinea | 6.11 | 6.37 | 6.63 | 5.70 | 4.49 |
| 21 | Cote d'Ivoire | 7.69 | 7.91 | 6.73 | 5.46 | 4.47 |
| 22 | Mauritania | 6.35 | 6.68 | 6.06 | 5.19 | 4.46 |
| 23 | Senegal | 7.00 | 7.25 | 6.40 | 5.19 | 4.45 |
| 24 | Zambia | 7.12 | 7.39 | 6.53 | 5.71 | 4.38 |
| 25 | Equatorial Guinea | 5.65 | 5.79 | 5.99 | 5.56 | 4.35 |
| 26 | Togo | 6.72 | 7.15 | 6.13 | 5.07 | 4.32 |
| 27 | Ethiopia | 6.88 | 7.14 | 7.24 | 5.97 | 4.24 |
| 28 | Rep. of Congo | 6.09 | 6.36 | 5.21 | 4.66 | 4.23 |
| 29 | Liberia | 6.39 | 6.74 | 6.37 | 5.52 | 4.17 |
| 30 | Guinea-Bissau | 5.92 | 6.15 | 6.51 | 5.45 | 4.09 |
| 31 | Sierra Leone | 6.18 | 6.55 | 6.57 | 5.81 | 4.08 |
| 32 | Comoros | 6.79 | 7.12 | 6.50 | 5.03 | 4.05 |
| 33 | Solomon Islands | 6.97 | 7.07 | 5.66 | 4.48 | 4.04 |
| 34 | Samoa | 7.65 | 6.68 | 4.93 | 4.37 | 4.00 |
| 35 | Malawi | 7.03 | 7.40 | 6.81 | 5.91 | 4.00 |
| 36 | Eritrea | 6.48 | 6.59 | 6.34 | 4.93 | 3.93 |
| 37 | Madagascar | 7.30 | 7.10 | 6.16 | 5.10 | 3.92 |
| 38 | Sao Tome & Principe | 6.24 | 6.53 | 5.83 | 4.96 | 3.89 |
| 39 | Yemen | 7.94 | 8.40 | 8.61 | 5.58 | 3.89 |
| 40 | Rwanda | 8.19 | 8.22 | 6.87 | 5.44 | 3.87 |
| 41 | Vanuatu | 6.86 | 6.09 | 5.03 | 4.16 | 3.78 |
| 42 | Ghana | 6.85 | 6.77 | 5.71 | 4.54 | 3.62 |
| 43 | West Bank & Gaza | NA | NA | 6.78 | 4.84 | 3.57 |
| 44 | Pakistan | 6.80 | 6.81 | 6.36 | 4.64 | 3.56 |
| 45 | Iraq | 5.30 | 6.88 | 5.88 | 4.48 | 3.55 |
| 46 | Gabon | 4.42 | 5.39 | 5.46 | 4.21 | 3.55 |
| 47 | Zimbabwe | 7.22 | 6.98 | 4.87 | 3.67 | 3.55 |
| 48 | Kenya | 7.63 | 7.88 | 6.13 | 4.78 | 3.40 |
| 49 | Namibia | 6.21 | 6.54 | 5.32 | 3.56 | 3.35 |
| 50 | Kiribati | 6.55 | 5.03 | 4.64 | 3.80 | 3.33 |
| 51 | Papua New Guinea | 6.02 | 6.07 | 5.18 | 4.22 | 3.27 |
| 52 | Tonga | 6.89 | 5.43 | 4.64 | 4.18 | 3.27 |
| 53 | Timor-Leste | 6.32 | 5.19 | 5.81 | 5.71 | 3.25 |
| 54 | Tajikistan | 6.55 | 6.60 | 5.34 | 3.44 | 3.24 |
| 55 | Tuvalu | 4.78 | 3.50 | 3.91 | 3.63 | 3.19 |
| 56 | Kazakhstan | 4.53 | 3.39 | 2.72 | 2.22 | 3.13 |
| 57 | Lesotho | 5.82 | 5.90 | 4.76 | 3.44 | 3.05 |
| 58 | Kyrgyzstan | 5.38 | 4.66 | 3.63 | 2.50 | 3.00 |
| 59 | Egypt | 6.79 | 5.80 | 4.48 | 3.15 | 2.96 |
| 60 | Algeria | 7.50 | 7.37 | 4.56 | 2.56 | 2.94 |
| 61 | Israel | 3.87 | 3.55 | 2.82 | 2.84 | 2.90 |
| 62 | Mongolia | 6.83 | 7.13 | 4.23 | 2.03 | 2.90 |
| 63 | Uzbekistan | 6.61 | 5.89 | 4.07 | 2.36 | 2.90 |
| 64 | Eswatini | 6.75 | 6.75 | 5.25 | 3.68 | 2.89 |
| 65 | Jordan | 7.67 | 7.89 | 5.48 | 3.78 | 2.87 |
| 66 | Haiti | 6.21 | 5.69 | 5.48 | 3.83 | 2.87 |
| 67 | Djibouti | 6.83 | 6.77 | 5.98 | 3.99 | 2.85 |
| 68 | Botswana | 6.63 | 6.58 | 4.49 | 3.08 | 2.84 |
| 69 | Syria | 7.49 | 7.47 | 5.38 | 3.81 | 2.80 |
| 70 | Philippines | 7.15 | 5.60 | 4.35 | 3.49 | 2.78 |
| 71 | Micronesia | 6.69 | 6.68 | 4.96 | 3.60 | 2.75 |
| 72 | Turkmenistan | 6.59 | 5.90 | 4.24 | 2.66 | 2.70 |
| 73 | Oman | 7.25 | 7.75 | 6.61 | 3.05 | 2.69 |
| 74 | Bolivia | 6.36 | 5.79 | 4.89 | 3.56 | 2.65 |
| 75 | Guam | 5.91 | 3.91 | 3.05 | 2.76 | 2.59 |
| 76 | Lao | 6.29 | 6.29 | 6.08 | 3.67 | 2.54 |
| 77 | Libya | 7.37 | 7.96 | 4.97 | 2.77 | 2.51 |
| 78 | Paraguay | 6.50 | 5.21 | 4.55 | 3.04 | 2.50 |
| 79 | Fiji | 6.46 | 4.10 | 3.41 | 2.89 | 2.50 |
| 80 | Guatemala | 6.96 | 6.41 | 5.48 | 3.97 | 2.48 |
| 81 | Saudi Arabia | 7.63 | 7.37 | 5.83 | 3.24 | 2.47 |
| 82 | Guyana | 6.37 | 4.50 | 3.07 | 2.84 | 2.42 |
| 83 | South Africa | 6.16 | 5.19 | 3.72 | 2.51 | 2.40 |
| 84 | Honduras | 7.46 | 6.86 | 5.29 | 3.55 | 2.39 |
| 85 | Cambodia | 6.25 | 4.10 | 5.64 | 3.24 | 2.38 |
| 86 | Suriname | 6.61 | 4.73 | 3.27 | 2.75 | 2.37 |
| 87 | Morocco | 7.04 | 6.27 | 4.02 | 2.57 | 2.35 |
| 88 | Nicaragua | 7.16 | 6.50 | 4.60 | 2.77 | 2.35 |
| 89 | Panama | 5.84 | 4.42 | 3.10 | 2.67 | 2.34 |
| 90 | Dominican Republic | 7.56 | 5.24 | 3.41 | 2.61 | 2.30 |
| 91 | Faroe Islands | NA | 2.90 | 2.80 | 2.60 | 2.30 |
| 92 | World | 4.70 | 4.08 | 3.31 | 2.60 | 2.30 |
| 93 | Seychelles | NA | NA | NA | 2.20 | 2.29 |
| 94 | Venezuela, RB | 6.36 | 4.69 | 3.45 | 2.63 | 2.23 |
| 95 | Peru | 6.94 | 5.71 | 3.91 | 2.69 | 2.22 |
| 96 | Indonesia | 5.55 | 5.04 | 3.10 | 2.43 | 2.19 |
| 97 | Myanmar | 5.98 | 5.29 | 3.54 | 2.55 | 2.17 |
| 98 | Kuwait | 7.16 | 6.09 | 3.32 | 2.66 | 2.14 |
| 99 | Tunisia | 6.94 | 6.03 | 3.47 | 1.98 | 2.11 |
| 100 | Lebanon | 5.82 | 4.56 | 3.30 | 2.20 | 2.10 |
| 101 | Nepal | 6.03 | 5.75 | 5.21 | 3.14 | 2.06 |
| 102 | Ecuador | 6.72 | 5.43 | 3.74 | 2.80 | 2.05 |
| 103 | India | 5.92 | 5.20 | 4.05 | 2.96 | 2.05 |
| 104 | New Caledonia | 6.28 | 3.70 | 3.18 | 2.20 | 2.04 |
| 105 | Virgin Islands | 5.45 | 3.63 | 2.99 | 2.24 | 2.03 |
| 106 | Grenada | 6.74 | 4.02 | 3.49 | 2.34 | 2.02 |
| 107 | Greenland | NA | 2.35 | 2.44 | 2.38 | 2.02 |
| 108 | Bangladesh | 6.78 | 6.74 | 4.48 | 2.81 | 2.00 |
| 109 | Sri Lanka | 5.47 | 3.79 | 2.52 | 2.28 | 2.00 |
| 110 | Belize | 6.50 | 6.28 | 4.70 | 3.13 | 2.00 |
| 111 | Georgia | 2.94 | 2.53 | 2.31 | 1.61 | 1.97 |
| 112 | Vietnam | 6.28 | 5.64 | 3.60 | 1.96 | 1.96 |
| 113 | Turkiye | 6.38 | 5.07 | 3.13 | 2.22 | 1.92 |
| 114 | Argentina | 3.08 | 3.30 | 3.03 | 2.43 | 1.91 |
| 115 | Cabo Verde | 6.89 | 6.77 | 5.39 | 2.93 | 1.91 |
| 116 | Mexico | 6.76 | 5.79 | 3.45 | 2.50 | 1.91 |
| 117 | Gibraltar | 3.01 | 2.62 | 2.44 | 1.70 | 1.86 |
| 118 | Bahrain | 7.15 | 5.62 | 3.76 | 2.62 | 1.83 |
| 119 | France | 2.85 | 2.09 | 1.77 | 1.94 | 1.83 |
| 120 | El Salvador | 6.63 | 5.68 | 3.95 | 2.46 | 1.82 |
| 121 | Malaysia | 6.41 | 4.52 | 3.37 | 2.33 | 1.82 |
| 122 | North Korea | 3.57 | 3.05 | 2.35 | 1.96 | 1.82 |
| 123 | Qatar | 6.65 | 6.10 | 4.18 | 2.58 | 1.82 |
| 124 | St. Vincent & the Grenadines | 7.29 | 4.98 | 2.83 | 2.07 | 1.81 |
| 125 | Brunei Darussalam | 6.84 | 4.99 | 3.29 | 2.02 | 1.80 |
| 126 | Moldova | 3.33 | 2.53 | 2.39 | 1.53 | 1.77 |
| 127 | Montenegro | 3.50 | 2.40 | 1.94 | 1.69 | 1.75 |
| 128 | Colombia | 6.74 | 4.40 | 3.08 | 2.26 | 1.74 |
| 129 | Iceland | 4.29 | 2.65 | 2.30 | 2.05 | 1.72 |
| 130 | Maldives | 6.80 | 7.19 | 6.09 | 2.24 | 1.71 |
| 131 | Czechia | 2.09 | 2.43 | 1.90 | 1.29 | 1.71 |
| 132 | Iran | 7.30 | 6.01 | 4.86 | 1.78 | 1.71 |
| 133 | French Polynesia | 5.89 | 4.71 | 3.44 | 2.19 | 1.71 |
| 134 | Azerbaijan | 5.88 | 4.18 | 2.74 | 2.00 | 1.70 |
| 135 | Denmark | 2.57 | 1.92 | 1.67 | 1.80 | 1.67 |
| 136 | Sweden | 2.17 | 1.77 | 2.13 | 1.77 | 1.66 |
| 137 | Brazil | 6.06 | 4.42 | 2.91 | 1.97 | 1.65 |
| 138 | U.S. | 3.65 | 1.77 | 2.08 | 2.06 | 1.64 |
| 139 | Trinidad and Tobago | 5.35 | 3.24 | 2.38 | 1.68 | 1.63 |
| 140 | Ireland | 3.78 | 3.37 | 2.11 | 1.86 | 1.63 |
| 141 | Barbados | 4.33 | 2.39 | 1.74 | 1.79 | 1.63 |
| 142 | New Zealand | 4.24 | 2.33 | 2.18 | 1.97 | 1.61 |
| 143 | Curacao | NA | NA | NA | NA | 1.60 |
| 144 | Romania | 2.34 | 2.59 | 1.83 | 1.40 | 1.60 |
| 145 | Slovenia | 2.19 | 2.18 | 1.46 | 1.26 | 1.60 |
| 146 | Australia | 3.45 | 2.15 | 1.90 | 1.81 | 1.58 |
| 147 | Estonia | 1.98 | 2.04 | 2.05 | 1.52 | 1.58 |
| 148 | Armenia | 4.79 | 2.96 | 2.71 | 1.54 | 1.58 |
| 149 | Slovak Republic | 3.04 | 2.55 | 2.09 | 1.27 | 1.57 |
| 150 | Antigua and Barbuda | 4.60 | 2.77 | 2.25 | 1.83 | 1.57 |
| 151 | Isle of Man | 2.88 | 2.05 | 1.92 | 1.85 | 1.57 |
| 152 | Bulgaria | 2.31 | 2.23 | 1.82 | 1.37 | 1.56 |
| 153 | United Kingdom | 2.69 | 1.81 | 1.83 | 1.76 | 1.56 |
| 154 | Hungary | 2.02 | 2.35 | 1.87 | 1.31 | 1.56 |
| 155 | Costa Rica | 6.71 | 3.80 | 3.21 | 2.04 | 1.56 |
| 156 | Belgium | 2.54 | 1.74 | 1.62 | 1.76 | 1.55 |
| 157 | Latvia | 1.94 | 1.96 | 2.02 | 1.39 | 1.55 |
| 158 | Netherlands | 3.12 | 1.66 | 1.62 | 1.71 | 1.55 |
| 159 | Chile | 4.70 | 3.18 | 2.58 | 1.80 | 1.54 |
| 160 | Germany | 2.37 | 1.45 | 1.45 | 1.34 | 1.53 |
| 161 | Kosovo | 6.36 | 5.25 | 3.65 | 2.61 | 1.53 |
| 162 | Russia | 2.52 | 1.98 | 1.89 | 1.29 | 1.51 |
| 163 | Cuba | 4.13 | 2.85 | 1.80 | 1.47 | 1.50 |
| 164 | Croatia | 2.23 | 1.96 | 1.63 | 1.50 | 1.48 |
| 165 | Lithuania | 2.56 | 2.18 | 2.03 | 1.29 | 1.48 |
| 166 | Norway | 2.85 | 1.98 | 1.93 | 1.84 | 1.48 |
| 167 | Serbia | NA | NA | NA | 1.45 | 1.48 |
| 168 | Uruguay | 2.83 | 3.02 | 2.43 | 2.10 | 1.48 |
| 169 | U.A.E | 6.72 | 6.26 | 4.54 | 2.20 | 1.46 |
| 170 | Switzerland | 2.44 | 1.61 | 1.58 | 1.42 | 1.46 |
| 171 | Austria | 2.69 | 1.83 | 1.46 | 1.41 | 1.44 |
| 172 | Mauritius | 6.17 | 3.20 | 2.32 | 1.88 | 1.44 |
| 173 | Bhutan | 6.70 | 6.62 | 5.60 | 2.80 | 1.43 |
| 174 | St. Lucia | 6.97 | 5.46 | 3.40 | 1.68 | 1.41 |
| 175 | Albania | 6.46 | 4.52 | 2.90 | 1.80 | 1.40 |
| 176 | Canada | 3.81 | 1.82 | 1.83 | 1.57 | 1.40 |
| 177 | Portugal | 3.16 | 2.75 | 1.56 | 1.41 | 1.40 |
| 178 | Bahamas | 4.82 | 3.26 | 2.53 | 2.05 | 1.39 |
| 179 | Belarus | 2.67 | 2.17 | 1.91 | 1.25 | 1.38 |
| 180 | Poland | 2.98 | 2.27 | 2.06 | 1.24 | 1.38 |
| 181 | Finland | 2.72 | 1.68 | 1.78 | 1.80 | 1.37 |
| 182 | Luxembourg | 2.29 | 1.55 | 1.60 | 1.63 | 1.37 |
| 183 | Bosnia & Herzegovina | 3.91 | 2.36 | 1.79 | 1.20 | 1.36 |
| 184 | Jamaica | 5.58 | 4.50 | 2.85 | 2.06 | 1.36 |
| 185 | Thailand | 6.25 | 4.40 | 2.09 | 1.59 | 1.34 |
| 186 | Greece | 2.23 | 2.33 | 1.39 | 1.34 | 1.34 |
| 187 | Japan | 2.00 | 1.91 | 1.54 | 1.26 | 1.34 |
| 188 | Cyprus | 3.51 | 2.11 | 2.41 | 1.48 | 1.33 |
| 189 | Aruba | 4.82 | 2.51 | 2.30 | 1.78 | 1.33 |
| 190 | Bermuda | NA | NA | NA | 1.76 | 1.30 |
| 191 | North Macedonia | 3.97 | 2.59 | 2.19 | 1.50 | 1.30 |
| 192 | China | 4.45 | 3.57 | 2.51 | 1.62 | 1.28 |
| 193 | Italy | 2.40 | 2.17 | 1.33 | 1.34 | 1.24 |
| 194 | Spain | 2.86 | 2.77 | 1.36 | 1.33 | 1.23 |
| 195 | Ukraine | 2.24 | 2.02 | 1.85 | 1.21 | 1.22 |
| 196 | Malta | 3.62 | 2.27 | 2.02 | 1.38 | 1.13 |
| 197 | Singapore | 5.76 | 2.07 | 1.83 | 1.26 | 1.10 |
| 198 | Macao SAR, China | 4.93 | 1.60 | 1.74 | 0.83 | 1.07 |
| 199 | British Virgin Islands | 5.16 | 3.36 | 1.59 | 1.34 | 0.98 |
| 200 | Puerto Rico | 4.80 | 2.77 | 2.38 | 1.77 | 0.90 |
| 201 | Hong Kong | 5.07 | 2.67 | 1.27 | 0.96 | 0.87 |
| 202 | South Korea | 5.95 | 3.43 | 1.57 | 1.09 | 0.84 |
The African country of Niger currently has the highest fertility rate, at 6.9, which means on average, a woman in Niger will have seven children in her lifetime.
With the exception of Afghanistan (14th), all of the top 30 countries are found on the African continent. In fact, it’s estimated that Africa will add 2.5 billion new people by 2100, while most continents will actually flatline in terms of population growth.
At the bottom of the rankings, the country with the lowest fertility rate is South Korea, at 0.84.
Interestingly, many of the current most populous countries of the world—including China, India, and the U.S.—are all below replacement levels of fertility, with parts of Europe and North America having had persistently low fertility levels since the 1970s.
However, even the countries that currently have high fertility rates have seen a steep decline over the last 60 years. Why?
Why are Fertility Rates Falling All Over The World?
Declining fertility rates are a consequence of a confluence of many related factors, including (but not limited to):
- Better access to contraception
- Improving opportunities for women, outside of childbearing
- Robust healthcare that lowers mortality rates of children
In the past, a larger number of children meant more chances of some making it to adulthood since infant mortality was so high. Women were also restricted to childbearing and rearing, and lacked access to contraception which led to increased—and sometimes unwanted—pregnancies.
Declining fertility rates are thus a triumph of improved socioeconomic development for many countries.
Consequences of Declining Fertility Rates
Although there are obvious issues with our large global population today, a different set of issues arise when fertility rates fall below replacement levels.
Dropping fertility rates can lead to shrinking populations and a higher ratio of the elderly to working adults—which will have unwanted economic consequences like increased healthcare costs and a reduced tax base.
Short-term solutions like immigration can help until populations are shrinking in every country. Longer-term solutions—reducing the cost of raising a child, and providing better support for families with children—are common strategies deployed to ward off demographic disaster.
The current crop of humanity has never had to contend with shrinking populations on a global scale. How will this reshape human livelihoods, priorities and expectations from life? We might soon find out.
Source: The World Bank.
Data note: The World Bank uses a number of sources to aggregate their data including the UN population division, Eurostat, and several national statistics programs. Data for some years is missing and has been marked as “NA.” Please visit their website for more information.


Demographics
Ranked: Countries Where Youth are the Most Unhappy, Relative to Older Generations
Conventional wisdom says that young adults (those below 30) tend to be the happiest demographic—but this is not true for these countries.
Countries with the Biggest Happiness Gaps Between Generations
This was originally posted on our Voronoi app. Download the app for free on iOS or Android and discover incredible data-driven charts from a variety of trusted sources.
“They say a person needs just three things to be truly happy in this world: someone to love, something to do, and something to hope for.” — Tom Bodett
Measuring happiness is tricky business, more so when taking into account how different regions, cultures, and faiths define it. Nevertheless, the World Happiness Report attempts to distill being happy into a single score out of 10, and then ranks countries by their average score.
We’ve visualized the high-level findings from the latest happiness report in this series of maps. However, the report also dives deeper into other significant trends in the data, such as a growing disparity in happiness between age groups within countries themselves.
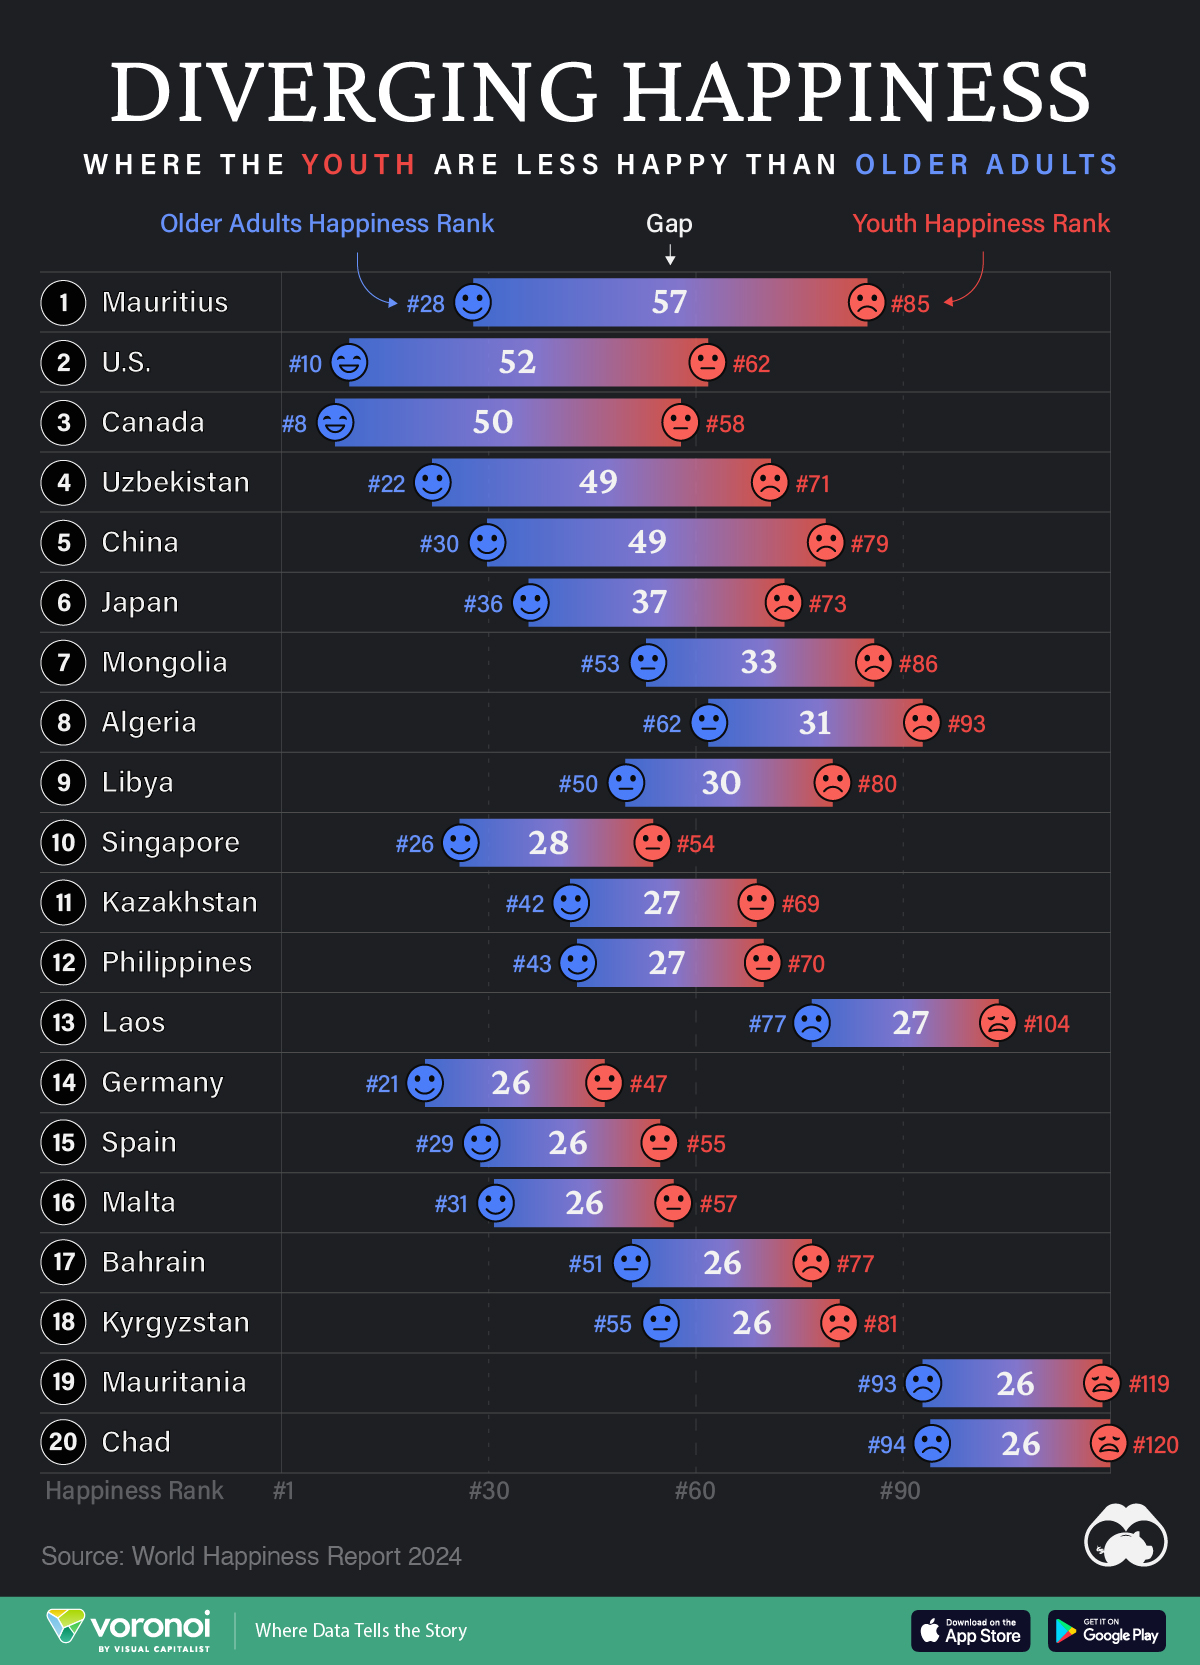
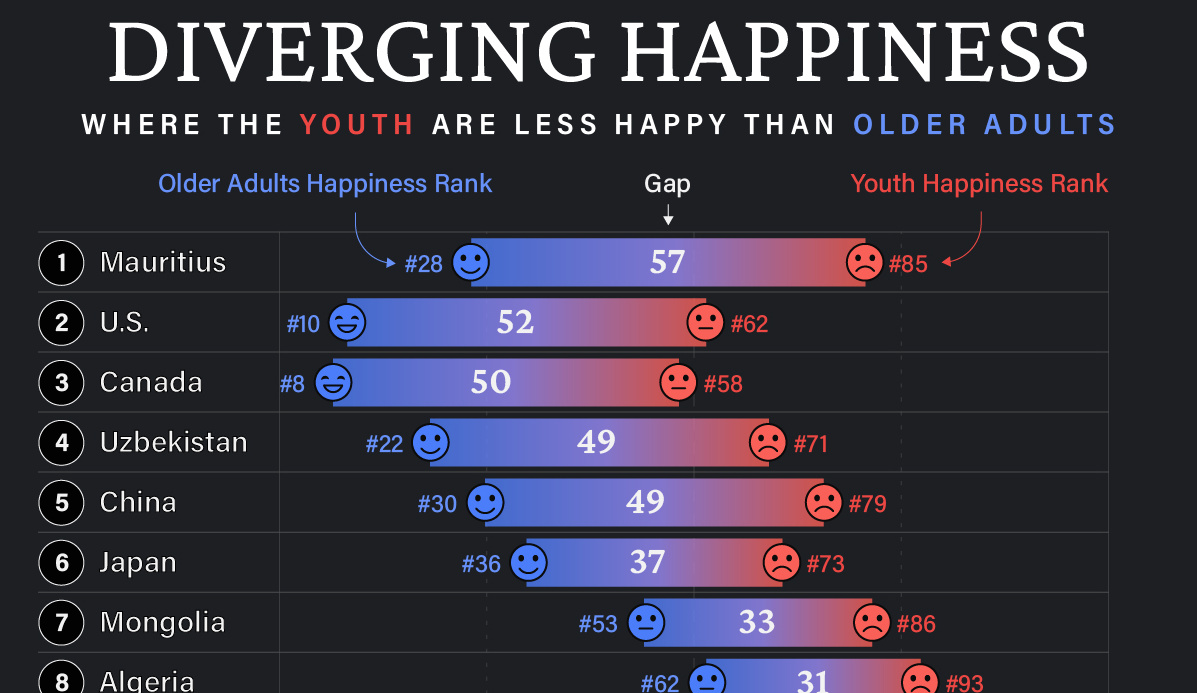
In the chart above, we list countries by the biggest gaps in happiness ranks between young adults (<30) and older adults (60+). A higher number indicates a larger gap, and that the youth are far unhappier than their older counterparts.
Where are Youth Unhappier than Older Adults?
Mauritius ranks first on this list, with a massive 57 place gap between older adult and youth happiness. The 1.26 million-inhabited island nation briefly reached high income status in 2020, but the pandemic hit hard, hurting its key tourism sector, and affecting jobs.
The country’s youth unemployment rate spiked to close to 25% that year, but has since been on the decline. Like residents on many similarly-populated islands, the younger demographic often moves abroad in search of more opportunities.
| Rank | Country | Youth Happiness Rank | Older Adult Happiness Rank | Happiness Gap |
|---|---|---|---|---|
| 1 | 🇲🇺 Mauritius | 85 | 28 | 57 |
| 2 | 🇺🇸 U.S. | 62 | 10 | 52 |
| 3 | 🇨🇦 Canada | 58 | 8 | 50 |
| 4 | 🇺🇿 Uzbekistan | 71 | 22 | 49 |
| 5 | 🇨🇳 China | 79 | 30 | 49 |
| 6 | 🇯🇵 Japan | 73 | 36 | 37 |
| 7 | 🇲🇳 Mongolia | 86 | 53 | 33 |
| 8 | 🇩🇿 Algeria | 93 | 62 | 31 |
| 9 | 🇱🇾 Libya | 80 | 50 | 30 |
| 10 | 🇸🇬 Singapore | 54 | 26 | 28 |
| 11 | 🇰🇿 Kazakhstan | 69 | 42 | 27 |
| 12 | 🇵🇭 Philippines | 70 | 43 | 27 |
| 13 | 🇱🇦 Laos | 104 | 77 | 27 |
| 14 | 🇩🇪 Germany | 47 | 21 | 26 |
| 15 | 🇪🇸 Spain | 55 | 29 | 26 |
| 16 | 🇲🇹 Malta | 57 | 31 | 26 |
| 17 | 🇧🇭 Bahrain | 77 | 51 | 26 |
| 18 | 🇰🇬 Kyrgyzstan | 81 | 55 | 26 |
| 19 | 🇲🇷 Mauritania | 119 | 93 | 26 |
| 20 | 🇹🇩 Chad | 120 | 94 | 26 |
Conventional wisdom says, and data somewhat correlates, that young adults (those below 30) tend to be the happiest demographic. Happiness then decreases through middle age and starts increasing around 60. However, the above countries are digressing from the pattern, with older generations being much happier than young adults.
That older generations are happier, by itself, is not a bad thing. However, that younger adults are so much unhappier in the same country can point to several unique stresses that those aged below 30 are facing.
For example, in the U.S. and Canada—both near the top of this list—many young adults feel like they have been priced out of owning a home: a once key metric of success.
Climate anxieties are also high, with worries about the future of the world they’ll inhabit. Finally, persistent economic inequities are also weighing on the younger generation, with many in that cohort feeling like they will never be able to afford to retire.
All of this comes alongside a rising loneliness epidemic, where those aged 18–25 report much higher rates of loneliness than the general population.
Source: The World Happiness Report which leverages data from the Gallup World Poll.
Methodology: A nationally representative group of approximately 1,000 people per country are asked to evaluate their life on a scale of 0–10. Scores are averaged across generations per country over three years. Countries are ranked by their scores out of 10.

-

 Personal Finance1 week ago
Visualizing the Tax Burden of Every U.S. State
-

 Misc6 days ago
Visualized: Aircraft Carriers by Country
-

 Culture6 days ago
How Popular Snack Brand Logos Have Changed
-

 Mining1 week ago
Visualizing Copper Production by Country in 2023
-

 Misc1 week ago
Charted: How Americans Feel About Federal Government Agencies
-

 Healthcare1 week ago
Which Countries Have the Highest Infant Mortality Rates?
-

 Demographics1 week ago
Mapped: U.S. Immigrants by Region
-

 Maps1 week ago
Mapped: Southeast Asia’s GDP Per Capita, by Country