Politics
How Much Do Countries Spend on Healthcare Compared to the Military?
Healthcare vs. Military Spending, by Country
Keeping citizens both healthy and secure are key priorities for many national governments around the world—but ultimately, decisions must be made on how tax dollars are spent to accomplish these objectives, and funding must fall into one bucket or another.
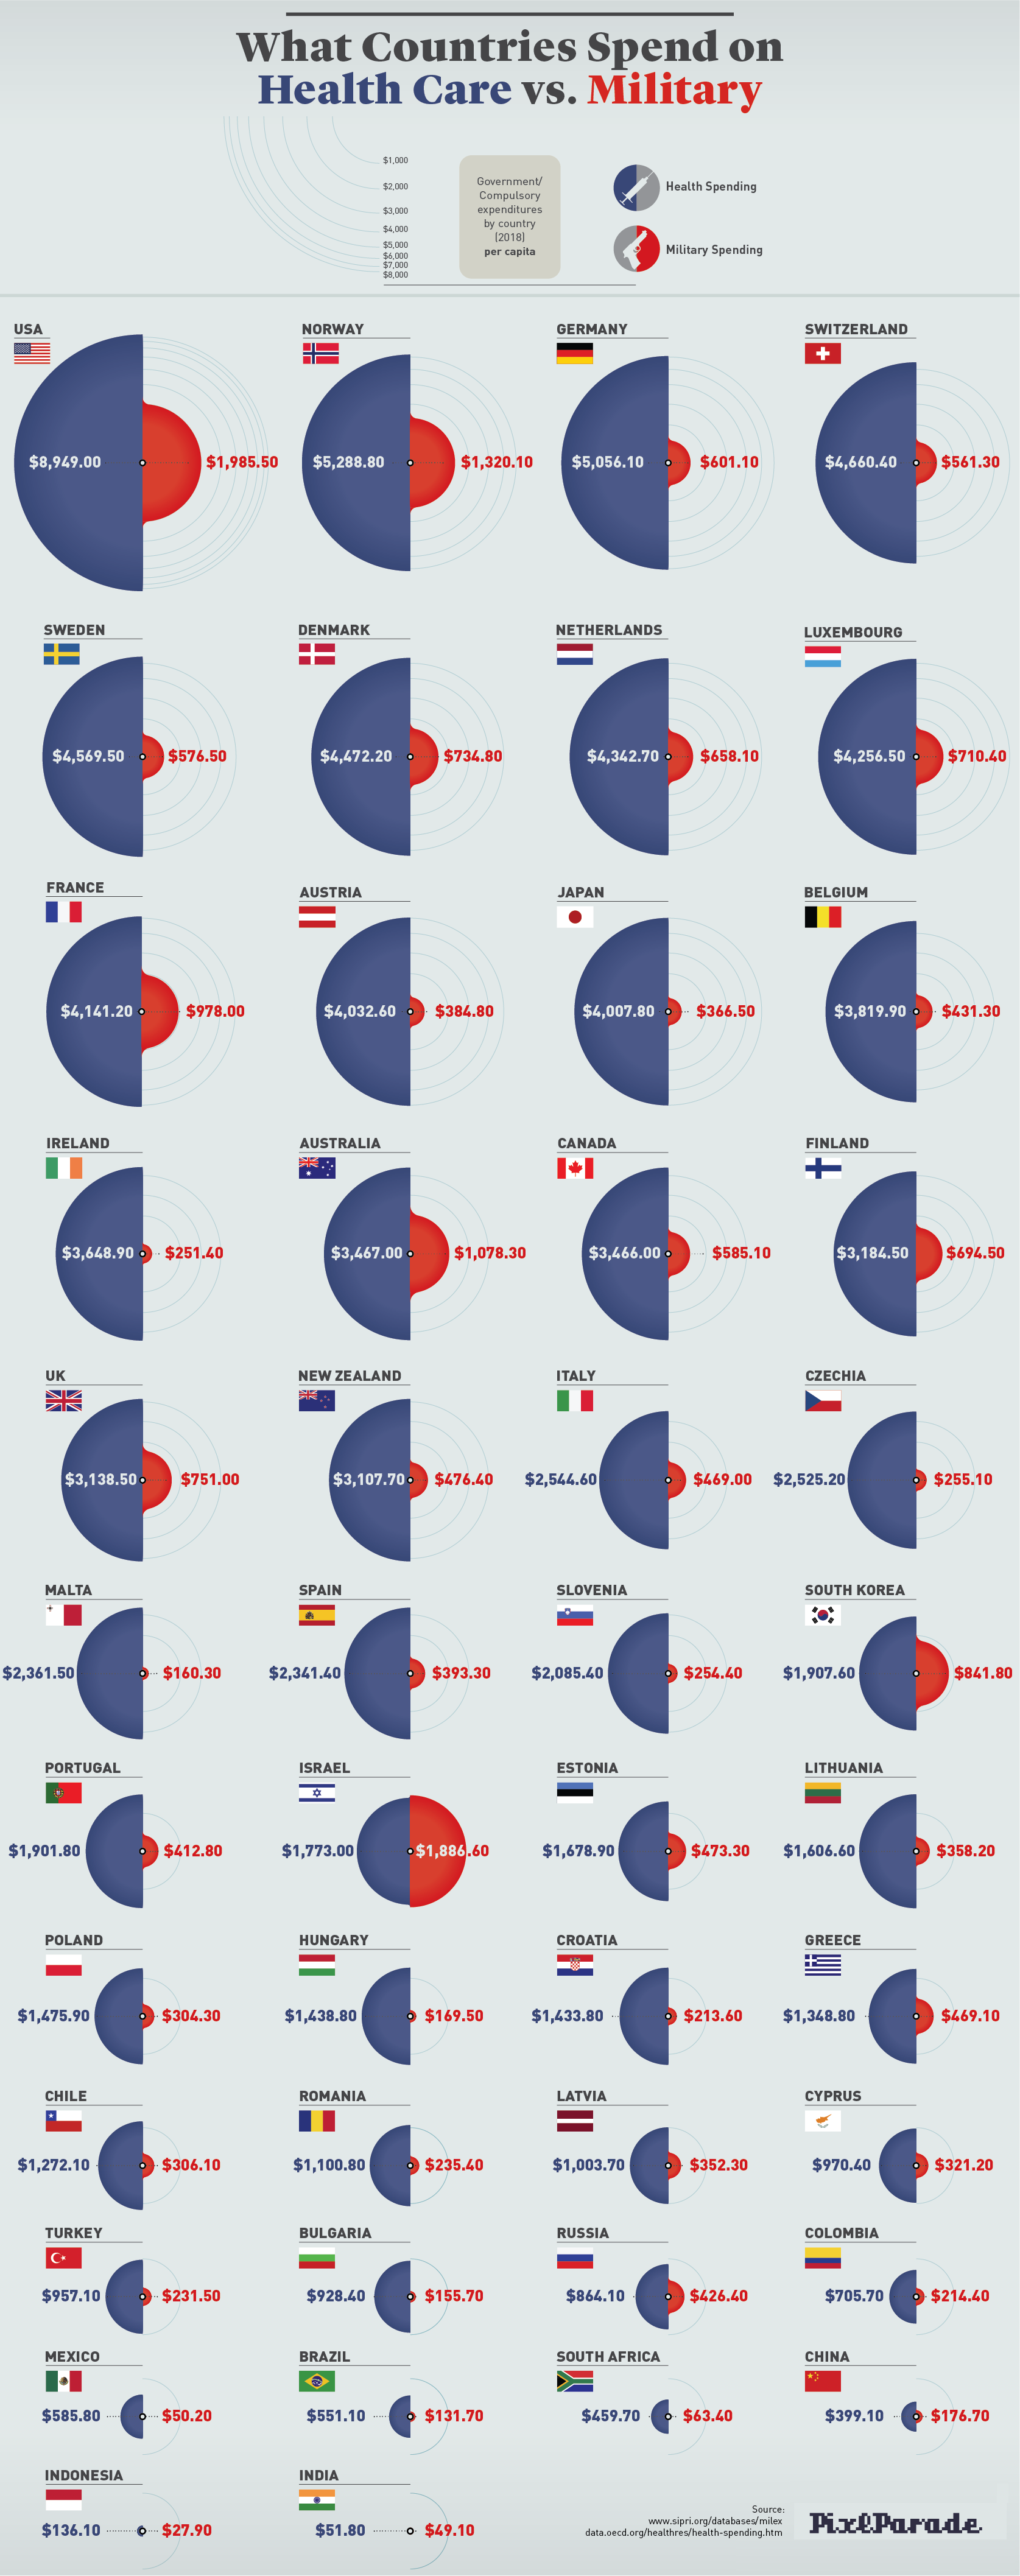
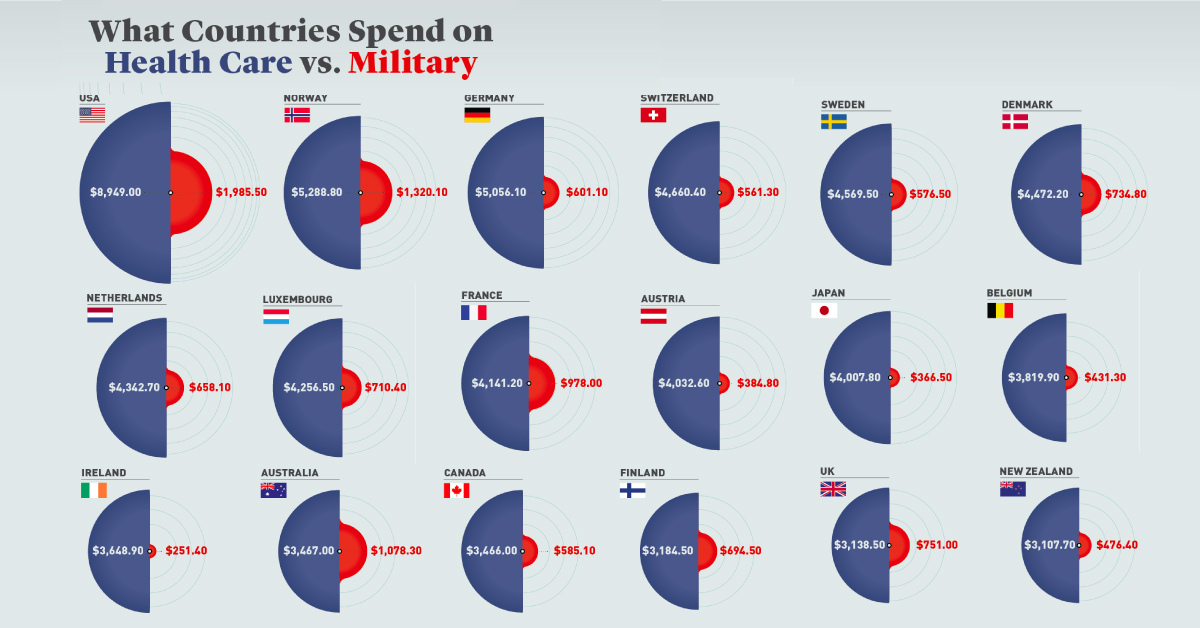
This infographic from PixlParade examines how much 46 different countries put towards healthcare and military spending in 2018, per capita.
Head to Head: Healthcare versus Military
Data for government and compulsory healthcare spending comes from the Organization for Economic Co-operation and Development (OECD). Note that these figures do not include spending through private insurance or out-of-pocket expenses.
Meanwhile, the data for military spending comes from the Stockholm International Peace Research Institute (SIPRI).
| Country | Health spending (Per capita, 2018 US$) | Military spending (Per capita, 2018 US$) |
|---|---|---|
| U.S. | $9,008.77 | $2,086.50 |
| Norway | $5,361.00 | $1,323.90 |
| Germany | $5,262.83 | $559.50 |
| Switzerland | $4,687.26 | $546.00 |
| Sweden | $4,623.68 | $574.90 |
| Netherlands | $4,461.30 | $651.50 |
| Denmark | $4,441.07 | $792.50 |
| Luxembourg | $4,385.66 | $650.80 |
| France | $4,310.55 | $791.00 |
| Austria | $4,137.25 | $381.00 |
| Belgium | $3,868.82 | $421.60 |
| Japan | $3,787.74 | $366.50 |
| Canada | $3,719.86 | $613.10 |
| Ireland | $3,629.43 | $229.80 |
| UK | $3,336.55 | $743.10 |
| Finland | $3,331.65 | $680.30 |
| Australia | $3,311.33 | $1,078.00 |
| NZ | $3,188.39 | $532.30 |
| Czhechia | $2,632.67 | $254.10 |
| Italy | $2,574.96 | $458.70 |
| Malta | $2,448.73 | $152.20 |
| Spain | $2,414.69 | $381.70 |
| Slovenia | $2,227.77 | $254.80 |
| Portugal | $1,906.23 | $431.00 |
| South Korea | $1,848.76 | $841.70 |
| Israel | $1,828.40 | $2,357.50 |
| Estonia | $1,744.57 | $458.60 |
| Lithuania | $1,599.15 | $377.10 |
| Croatia | $1,553.67 | $232.50 |
| Poland | $1,511.18 | $317.50 |
| Hungary | $1,493.01 | $184.60 |
| Romania | $1,344.34 | $223.50 |
| Greece | $1,331.19 | $547.10 |
| Chile | $1,282.59 | $296.10 |
| Latvia | $1,111.67 | $375.20 |
| Cyprus | $1,103.03 | $374.30 |
| Bulgaria | $1,042.85 | $136.30 |
| Turkey | $946.83 | $238.60 |
| Russia | $873.00 | $421.20 |
| Colombia | $864.16 | $204.10 |
| Mexico | $582.05 | $46.30 |
| Brazil | $388.98 | $134.50 |
| South Africa | $267.85 | $63.50 |
| China | $249.83 | $177.60 |
| Indonesia | $55.62 | $28.20 |
| India | $18.80 | $49.00 |
| Source: OECD | Source: SIPRI |
Note: There are minor discrepancies in comparing table data to original sources due to recent estimate updates. Figures for Brazil, South Africa, China, Indonesia, and India come from the World Bank (2017).
The Top 10 Healthcare Spenders
The U.S. leads the world in government healthcare spending at $9,008 per capita – over 1.5 times that of Norway, the next-highest country examined.
| Country | Per capita health spending | % of GDP | % of health spending |
|---|---|---|---|
| U.S. | $9,008.77 | 14.3% | 84.7% |
| Norway | $5,361.00 | 8.6% | 85.3% |
| Germany | $5,262.83 | 9.7% | 84.6% |
| Switzerland | $4,687.26 | 7.6% | 64.4% |
| Sweden | $4,623.68 | 9.3% | 85.1% |
| Netherlands | $4,461.30 | 8.2% | 82.1% |
| Denmark | $4,441.07 | 8.5% | 83.9% |
| Luxembourg | $4,385.66 | 4.4% | 84.1% |
| France | $4,310.55 | 9.4% | 83.6% |
| Austria | $4,137.25 | 7.7% | 74.7% |
While per-capita government spending on healthcare in the U.S. is the highest in the world, this has not necessarily brought about better outcomes (such as longer life expectancy) compared to other developed nations.
It’s also worth mentioning that the above figures do not cover all healthcare costs incurred by citizens, as they do not account for private insurance spending or out-of-pocket expenses. According to OECD data, these additional costs tend to be the highest in places like Switzerland and the United States.
The Top 10 Military Spenders
Israel has the highest rate of military spending per capita, and has the distinction of being the only country on this list to invest more in defense than in healthcare.
| Country | Per capita military spending | % of GDP | Total expenditure, US$M |
|---|---|---|---|
| Israel | $2,357.50 | 5.3% | $19,759M |
| U.S. | $2,086.50 | 3.3% | $682,491M |
| Norway | $1,323.90 | 1.6% | $7,067M |
| Australia | $1,078.00 | 1.9% | $26,840M |
| South Korea | $841.70 | 2.5% | $43,070M |
| Denmark | $792.50 | 1.3% | $4,559M |
| France | $791.00 | 1.3% | $51,410M |
| UK | $743.10 | 1.8% | $49,892M |
| Finland | $680.30 | 1.4% | $3,757M |
| Netherlands | $651.50 | 1.2% | $11,115M |
Although the United States comes in second place here as well, in absolute terms, the U.S. puts more money into military expenditures than many other countries combined, at almost $700 billion per year.


Public Opinion
Charted: How Democrats and Republicans View Government Agencies
Predictably, results diverge when both Democrats and Republicans are asked to rate key government agencies in the United States.

How Democrats and Republicans View Government Agencies
This was originally posted on our Voronoi app. Download the app for free on iOS or Android and discover incredible data-driven charts from a variety of trusted sources.
Forget the presidential race, the partisan divide in America can also be seen by how Democrats and Republicans feel about key government agencies.
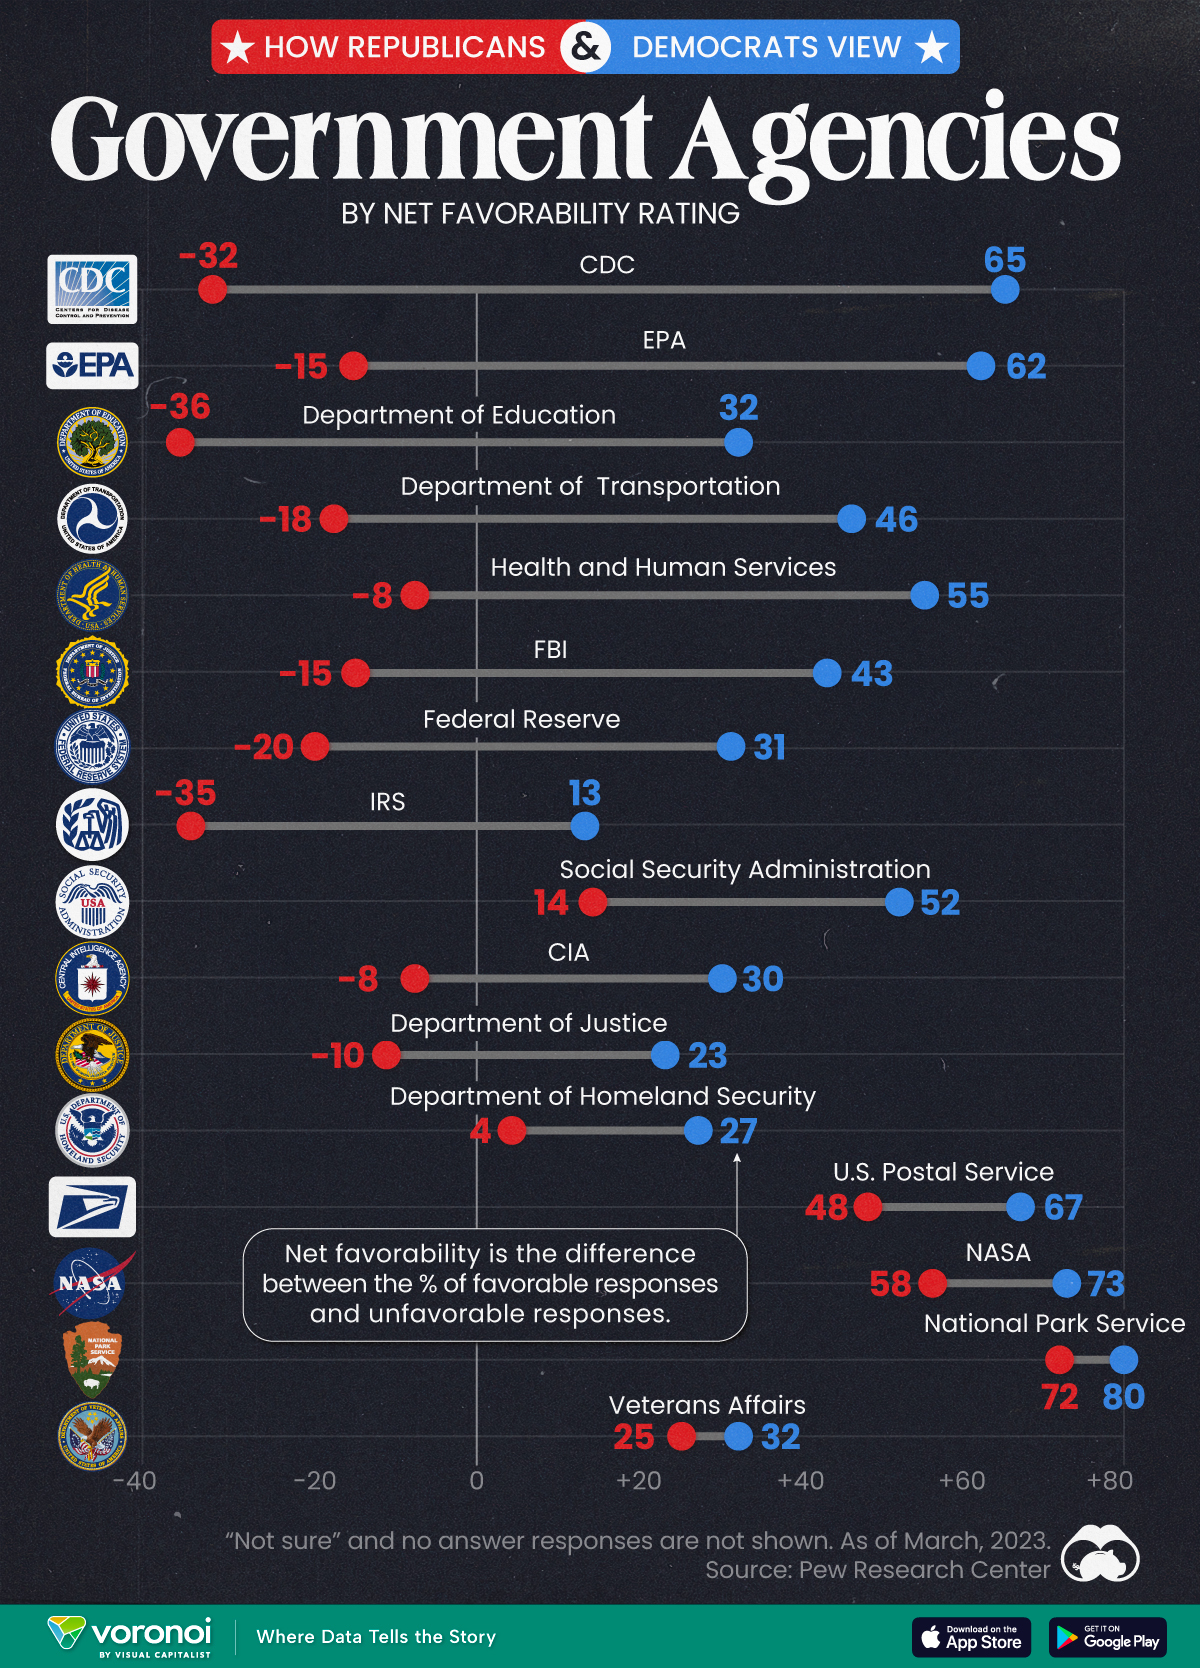
We visualize the net favorability ratings of 16 federal government agencies, based on respondent party affiliation.
To find this data, Pew Research Center surveyed more than 10,000 adults, between March 13-19, 2023. View their methodology page for more details about the survey, the questions asked, and the results obtained.
Republicans Don’t Like How the CDC Handled the Pandemic
The division in net favorability is deepest for three federal government agencies. While the CDC garnered a net favorability rating of 65 from Democrats, more Republicans rated the agency unfavorably, leading to a net favorability rating of -32.
Similarly, with the EPA and the Department of Education, the difference in net favorability between the two voting sides is as high as 70–80 points.
| Federal Agency | Republican Net Favorability Rating | Democrat Net Favorability Rating |
|---|---|---|
| 🔬 CDC | -32 | 65 |
| 🌿 EPA | -15 | 62 |
| 📚 Department of Education | -36 | 32 |
| 🚗 Department of Transportation | -18 | 46 |
| 💉 Health and Humans Services | -8 | 55 |
| 💰 Federal Reserve* | -20 | 31 |
| 🕵️ FBI | -15 | 43 |
| 💼 IRS | -35 | 13 |
| 💼 Social Security Admin | 14 | 52 |
| 🕵️♂️ CIA | -8 | 30 |
| ⚖️ Justice Department | -10 | 23 |
| 🛡️ Homeland Security | 4 | 27 |
| 📮 USPS | 48 | 67 |
| 🚀 NASA | 58 | 73 |
| 🏞️ Park Service | 72 | 80 |
| 🎖️ Veterans Affairs | 25 | 32 |
Note: *The Federal Reserve is considered an instrument of the federal government but does not receive funding from it. However, it is not a private entity either, despite sharing certain characteristics with one. Figures are rounded. No answer responses are not shown.
Pew Research Center notes that Republicans didn’t always view the CDC quite so unfavorably, though a direct comparison is impossible.
Nevertheless, per the source, in March 2020, 84% of surveyed Republicans expressed positive views of the CDC’s performance. By October 2022, just 32% said the CDC had done an excellent or good job of handling the pandemic.
Meanwhile, there are a few agencies the two sides do agree on: the National Park Service, the Postal Service, and NASA.
And they both agree on Veterans Affairs as well: though neither share a particularly high opinion of the organization.
Finally, Democrats consistently rate all sixteen agencies on the survey more favorably than Republicans, showing consistency about how each side views the government in general.

-

 Public Opinion6 days ago
Charted: How Americans Feel About Federal Government Agencies
-

 Healthcare2 weeks ago
What Causes Preventable Child Deaths?
-

 Energy2 weeks ago
Who’s Building the Most Solar Energy?
-

 Markets2 weeks ago
Mapped: The Most Valuable Company in Each Southeast Asian Country
-

 Technology1 week ago
Mapped: The Number of AI Startups By Country
-

 Healthcare1 week ago
Life Expectancy by Region (1950-2050F)
-

 Markets1 week ago
The Growth of a $1,000 Equity Investment, by Stock Market
-

 Markets1 week ago
Mapped: Europe’s GDP Per Capita, by Country